
|
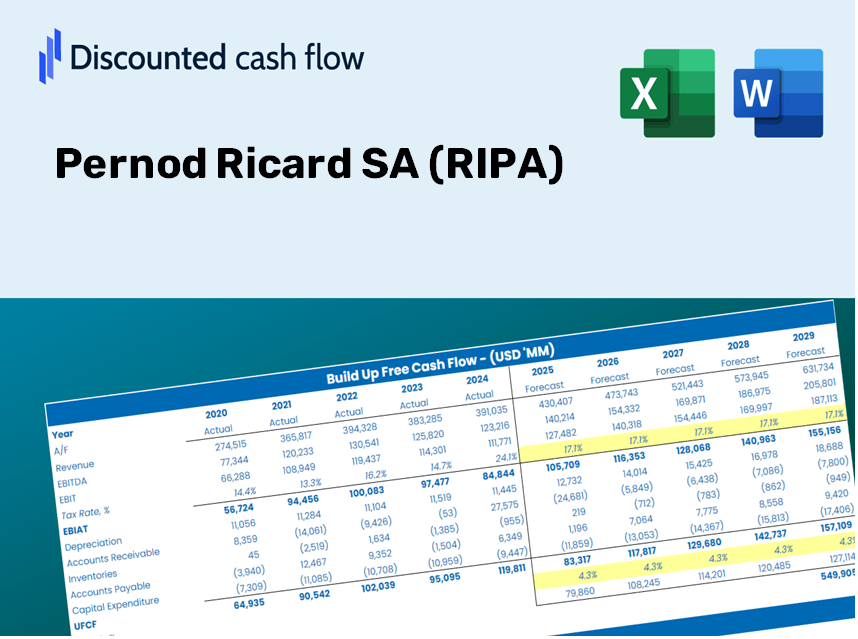
Valoración de DCF Pernod Ricard SA (RI.PA) |
Completamente Editable: Adáptelo A Sus Necesidades En Excel O Sheets
Diseño Profesional: Plantillas Confiables Y Estándares De La Industria
Predeterminadas Para Un Uso Rápido Y Eficiente
Compatible con MAC / PC, completamente desbloqueado
No Se Necesita Experiencia; Fáciles De Seguir
Pernod Ricard SA (RI.PA) Bundle
¡Explore el futuro financiero de Pernod Ricard SA (RIPA) con nuestra calculadora DCF fácil de usar! Ingrese sus suposiciones para el crecimiento, los márgenes y los costos para calcular el valor intrínseco de Pernod Ricard SA (RIPA) y mejorar su estrategia de inversión.
Discounted Cash Flow (DCF) - (USD MM)
| Year | AY1 2021 |
AY2 2022 |
AY3 2023 |
AY4 2024 |
AY5 2025 |
FY1 2026 |
FY2 2027 |
FY3 2028 |
FY4 2029 |
FY5 2030 |
|---|---|---|---|---|---|---|---|---|---|---|
| Revenue | 8,824.0 | 10,701.0 | 12,137.0 | 11,598.0 | 10,959.0 | 11,636.8 | 12,356.6 | 13,120.8 | 13,932.4 | 14,794.1 |
| Revenue Growth, % | 0 | 21.27 | 13.42 | -4.44 | -5.51 | 6.19 | 6.19 | 6.19 | 6.19 | 6.19 |
| EBITDA | 2,634.0 | 3,334.0 | 3,754.0 | 3,187.0 | 3,278.0 | 3,475.4 | 3,690.3 | 3,918.6 | 4,161.0 | 4,418.3 |
| EBITDA, % | 29.85 | 31.16 | 30.93 | 27.48 | 29.91 | 29.87 | 29.87 | 29.87 | 29.87 | 29.87 |
| Depreciation | 367.0 | 381.0 | 417.0 | 441.0 | 327.0 | 417.6 | 443.4 | 470.8 | 499.9 | 530.9 |
| Depreciation, % | 4.16 | 3.56 | 3.44 | 3.8 | 2.98 | 3.59 | 3.59 | 3.59 | 3.59 | 3.59 |
| EBIT | 2,267.0 | 2,953.0 | 3,337.0 | 2,746.0 | 2,951.0 | 3,057.8 | 3,246.9 | 3,447.8 | 3,661.0 | 3,887.5 |
| EBIT, % | 25.69 | 27.6 | 27.49 | 23.68 | 26.93 | 26.28 | 26.28 | 26.28 | 26.28 | 26.28 |
| Total Cash | 2,078.0 | 2,527.0 | 1,609.0 | 2,683.0 | 1,829.0 | 2,333.0 | 2,477.3 | 2,630.6 | 2,793.3 | 2,966.0 |
| Total Cash, percent | .0 | .0 | .0 | .0 | .0 | .0 | .0 | .0 | .0 | .0 |
| Account Receivables | 1,154.0 | 1,422.0 | 1,858.0 | 1,604.0 | 1,485.0 | 1,607.2 | 1,706.6 | 1,812.1 | 1,924.2 | 2,043.2 |
| Account Receivables, % | 13.08 | 13.29 | 15.31 | 13.83 | 13.55 | 13.81 | 13.81 | 13.81 | 13.81 | 13.81 |
| Inventories | 6,594.0 | 7,420.0 | 8,146.0 | 8,255.0 | 8,418.0 | 8,359.3 | 8,876.3 | 9,425.3 | 10,008.3 | 10,627.3 |
| Inventories, % | 74.73 | 69.34 | 67.12 | 71.18 | 76.81 | 71.83 | 71.83 | 71.83 | 71.83 | 71.83 |
| Accounts Payable | 2,337.0 | 3,019.0 | 3,461.0 | 2,930.0 | 2,711.0 | 3,100.4 | 3,292.1 | 3,495.7 | 3,712.0 | 3,941.6 |
| Accounts Payable, % | 26.48 | 28.21 | 28.52 | 25.26 | 24.74 | 26.64 | 26.64 | 26.64 | 26.64 | 26.64 |
| Capital Expenditure | -433.0 | -506.0 | -702.0 | -773.0 | .0 | -514.0 | -545.8 | -579.5 | -615.4 | -653.4 |
| Capital Expenditure, % | -4.91 | -4.73 | -5.78 | -6.66 | 0 | -4.42 | -4.42 | -4.42 | -4.42 | -4.42 |
| Tax Rate, % | 27.73 | 27.73 | 27.73 | 27.73 | 27.73 | 27.73 | 27.73 | 27.73 | 27.73 | 27.73 |
| EBITAT | 1,486.7 | 2,180.6 | 2,569.2 | 1,772.2 | 2,132.6 | 2,160.2 | 2,293.8 | 2,435.6 | 2,586.3 | 2,746.2 |
| Depreciation | ||||||||||
| Changes in Account Receivables | ||||||||||
| Changes in Inventories | ||||||||||
| Changes in Accounts Payable | ||||||||||
| Capital Expenditure | ||||||||||
| UFCF | -3,990.3 | 1,643.6 | 1,564.2 | 1,054.2 | 2,196.6 | 2,389.6 | 1,766.7 | 1,876.0 | 1,992.0 | 2,115.2 |
| WACC, % | 4.65 | 4.77 | 4.81 | 4.64 | 4.74 | 4.72 | 4.72 | 4.72 | 4.72 | 4.72 |
| PV UFCF | ||||||||||
| SUM PV UFCF | 8,862.2 | |||||||||
| Long Term Growth Rate, % | 3.00 | |||||||||
| Free cash flow (T + 1) | 2,179 | |||||||||
| Terminal Value | 126,551 | |||||||||
| Present Terminal Value | 100,481 | |||||||||
| Enterprise Value | 109,344 | |||||||||
| Net Debt | 10,760 | |||||||||
| Equity Value | 98,584 | |||||||||
| Diluted Shares Outstanding, MM | 252 | |||||||||
| Equity Value Per Share | 391.19 |
What You Will Receive
- Adjustable Forecast Inputs: Seamlessly modify assumptions (growth %, profit margins, WACC) to explore various scenarios.
- Real-World Data: Pernod Ricard’s financial data pre-loaded to kickstart your analysis.
- Automatic DCF Outputs: The template computes Net Present Value (NPV) and intrinsic value automatically for you.
- Tailored and Professional: A refined Excel model that aligns with your valuation requirements.
- Designed for Analysts and Investors: Perfect for evaluating projections, confirming strategies, and enhancing efficiency.
Key Features
- Genuine Pernod Ricard Financials: Gain access to precise pre-loaded historical data and future forecasts for Pernod Ricard SA (RIPA).
- Adjustable Forecast Parameters: Modify the highlighted cells for WACC, growth rates, and margins to fit your analysis.
- Real-Time Calculations: Enjoy automatic updates to DCF, Net Present Value (NPV), and cash flow assessments.
- User-Friendly Dashboard: Intuitive charts and summaries for easy visualization of your valuation findings.
- Designed for All Levels: A straightforward, user-friendly format suitable for investors, CFOs, and consultants alike.
How It Functions
- Download: Obtain the ready-to-use Excel template featuring Pernod Ricard SA's (RIPA) financial data.
- Customize: Modify projections, including revenue growth, EBITDA %, and WACC.
- Update Automatically: The intrinsic value and NPV calculations refresh in real-time.
- Test Scenarios: Develop various projections and instantly compare results.
- Make Decisions: Leverage the valuation outcomes to shape your investment strategy.
Why Choose This Calculator for Pernod Ricard SA (RIPA)?
- Reliable Data: Access real financials from Pernod Ricard for trustworthy valuation outcomes.
- Customizable Options: Modify key factors such as growth rates, WACC, and tax rates to align with your forecasts.
- Efficient: Ready-to-use calculations save you the hassle of building from the ground up.
- Professional Quality: Tailored for investors, analysts, and consultants in the beverage industry.
- Easy to Use: A user-friendly design with clear, step-by-step guidance suitable for all experience levels.
Who Should Use This Product?
- Individual Investors: Gain insights to make informed decisions about buying or selling Pernod Ricard (RIPA) stock.
- Financial Analysts: Enhance valuation processes with ready-to-implement financial models related to Pernod Ricard (RIPA).
- Consultants: Provide clients with accurate and timely valuation insights about Pernod Ricard (RIPA).
- Business Owners: Learn how large corporations like Pernod Ricard (RIPA) are valued to inform your own business strategy.
- Finance Students: Explore valuation techniques through real-world examples and data involving Pernod Ricard (RIPA).
Contents of the Template
- Pre-Filled Data: Contains historical financials and projections for Pernod Ricard SA (RIPA).
- Discounted Cash Flow Model: An editable DCF valuation model with automated calculations.
- Weighted Average Cost of Capital (WACC): A dedicated sheet for WACC computation based on user-defined inputs.
- Key Financial Ratios: Evaluate Pernod Ricard’s profitability, efficiency, and debt management.
- Customizable Inputs: Easily modify revenue growth, profit margins, and tax assumptions.
- Concise Dashboard: Visualizations and tables that highlight essential valuation findings.
Disclaimer
All information, articles, and product details provided on this website are for general informational and educational purposes only. We do not claim any ownership over, nor do we intend to infringe upon, any trademarks, copyrights, logos, brand names, or other intellectual property mentioned or depicted on this site. Such intellectual property remains the property of its respective owners, and any references here are made solely for identification or informational purposes, without implying any affiliation, endorsement, or partnership.
We make no representations or warranties, express or implied, regarding the accuracy, completeness, or suitability of any content or products presented. Nothing on this website should be construed as legal, tax, investment, financial, medical, or other professional advice. In addition, no part of this site—including articles or product references—constitutes a solicitation, recommendation, endorsement, advertisement, or offer to buy or sell any securities, franchises, or other financial instruments, particularly in jurisdictions where such activity would be unlawful.
All content is of a general nature and may not address the specific circumstances of any individual or entity. It is not a substitute for professional advice or services. Any actions you take based on the information provided here are strictly at your own risk. You accept full responsibility for any decisions or outcomes arising from your use of this website and agree to release us from any liability in connection with your use of, or reliance upon, the content or products found herein.