
|
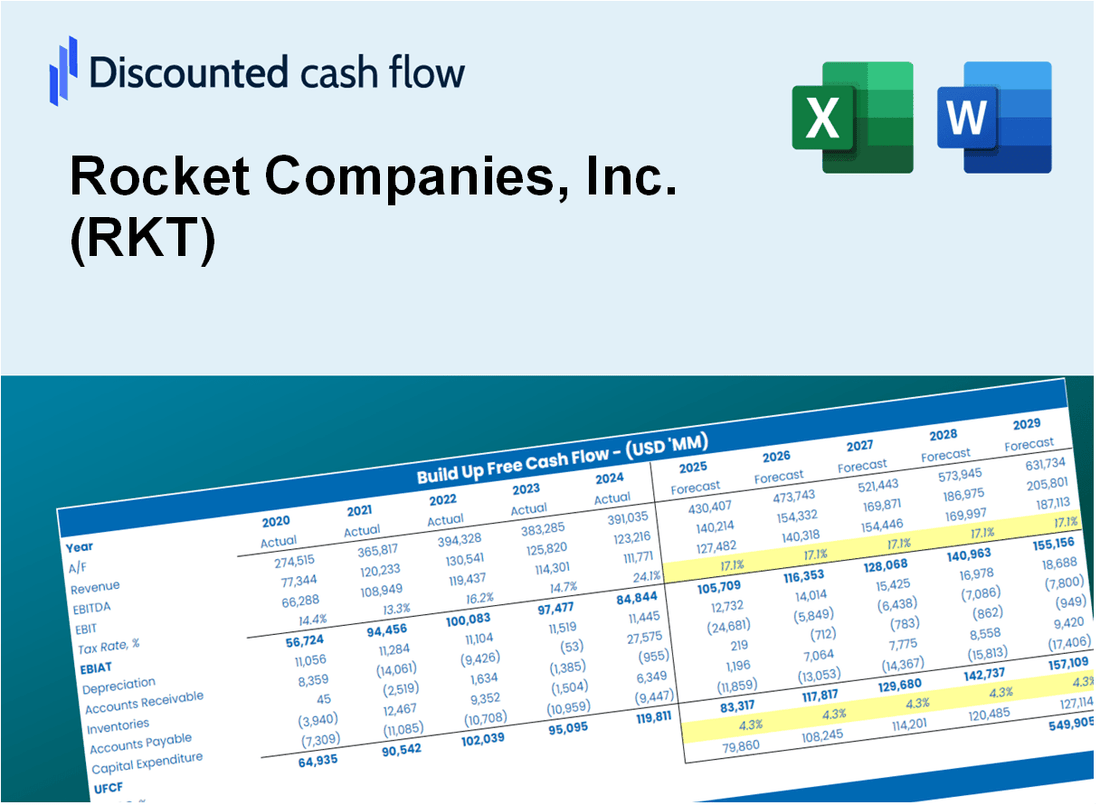
Valoración DCF de Rocket Companies, Inc. (RKT) |
Completamente Editable: Adáptelo A Sus Necesidades En Excel O Sheets
Diseño Profesional: Plantillas Confiables Y Estándares De La Industria
Predeterminadas Para Un Uso Rápido Y Eficiente
Compatible con MAC / PC, completamente desbloqueado
No Se Necesita Experiencia; Fáciles De Seguir
Rocket Companies, Inc. (RKT) Bundle
¡Agilice su análisis y mejore la precisión con nuestra calculadora DCF (RKT)! Utilizando datos reales de Rocket Companies, Inc. y suposiciones personalizables, esta herramienta le permite pronosticar, analizar y valor (RKT) como un inversor experto.
What You Will Get
- Real Rocket Companies Data: Preloaded financials – from revenue to EBIT – based on actual and projected figures for Rocket Companies, Inc. (RKT).
- Full Customization: Adjust all critical parameters (yellow cells) like WACC, growth %, and tax rates specific to Rocket Companies, Inc. (RKT).
- Instant Valuation Updates: Automatic recalculations to analyze the impact of changes on Rocket Companies, Inc.'s (RKT) fair value.
- Versatile Excel Template: Tailored for quick edits, scenario testing, and detailed projections for Rocket Companies, Inc. (RKT).
- Time-Saving and Accurate: Skip building models from scratch while maintaining precision and flexibility for Rocket Companies, Inc. (RKT).
Key Features
- Customizable Financial Inputs: Adjust essential metrics such as revenue growth, EBITDA %, and capital expenditures.
- Instant DCF Valuation: Quickly computes intrinsic value, NPV, and other key financial outputs.
- High-Precision Accuracy: Leverages Rocket Companies' actual financial data for reliable valuation results.
- Effortless Scenario Analysis: Easily evaluate various assumptions and analyze different outcomes.
- Efficiency Booster: Avoid the hassle of constructing intricate valuation models from the ground up.
How It Works
- 1. Access the Template: Download and open the Excel file containing Rocket Companies, Inc. (RKT) preloaded data.
- 2. Modify Assumptions: Adjust key inputs such as growth rates, WACC, and capital expenditures.
- 3. View Results Instantly: The DCF model automatically calculates intrinsic value and NPV for Rocket Companies, Inc. (RKT).
- 4. Explore Scenarios: Analyze various forecasts to evaluate different valuation outcomes for Rocket Companies, Inc. (RKT).
- 5. Present with Confidence: Showcase professional valuation insights to enhance your decision-making for Rocket Companies, Inc. (RKT).
Why Choose This Calculator for Rocket Companies, Inc. (RKT)?
- Precision: Accurate financial data from Rocket Companies ensures reliability.
- Adaptability: Tailored for users to explore and adjust inputs as needed.
- Efficiency: Eliminate the complexity of constructing a DCF model from the ground up.
- Expert-Level: Crafted with the attention to detail expected by CFOs and industry professionals.
- Intuitive: Simple to navigate, making it accessible for individuals without extensive financial modeling skills.
Who Should Use This Product?
- Professional Investors: Develop comprehensive and accurate valuation models for analyzing Rocket Companies, Inc. (RKT) investments.
- Corporate Finance Teams: Evaluate valuation scenarios to inform strategic decisions within their organizations.
- Consultants and Advisors: Deliver precise valuation insights for clients interested in Rocket Companies, Inc. (RKT).
- Students and Educators: Utilize real-world data to enhance learning and practice in financial modeling.
- Real Estate Enthusiasts: Gain insights into how companies like Rocket Companies, Inc. (RKT) are valued in the real estate market.
What the Template Contains
- Preloaded RKT Data: Historical and projected financial data, including revenue, EBIT, and capital expenditures.
- DCF and WACC Models: Professional-grade sheets for calculating intrinsic value and Weighted Average Cost of Capital.
- Editable Inputs: Yellow-highlighted cells for adjusting revenue growth, tax rates, and discount rates.
- Financial Statements: Comprehensive annual and quarterly financials for deeper analysis.
- Key Ratios: Profitability, leverage, and efficiency ratios to evaluate performance.
- Dashboard and Charts: Visual summaries of valuation outcomes and assumptions.
Disclaimer
All information, articles, and product details provided on this website are for general informational and educational purposes only. We do not claim any ownership over, nor do we intend to infringe upon, any trademarks, copyrights, logos, brand names, or other intellectual property mentioned or depicted on this site. Such intellectual property remains the property of its respective owners, and any references here are made solely for identification or informational purposes, without implying any affiliation, endorsement, or partnership.
We make no representations or warranties, express or implied, regarding the accuracy, completeness, or suitability of any content or products presented. Nothing on this website should be construed as legal, tax, investment, financial, medical, or other professional advice. In addition, no part of this site—including articles or product references—constitutes a solicitation, recommendation, endorsement, advertisement, or offer to buy or sell any securities, franchises, or other financial instruments, particularly in jurisdictions where such activity would be unlawful.
All content is of a general nature and may not address the specific circumstances of any individual or entity. It is not a substitute for professional advice or services. Any actions you take based on the information provided here are strictly at your own risk. You accept full responsibility for any decisions or outcomes arising from your use of this website and agree to release us from any liability in connection with your use of, or reliance upon, the content or products found herein.