
|
Valoración de DCF de Reckitt Benckiser Group PLC (RKT.L) |
Completamente Editable: Adáptelo A Sus Necesidades En Excel O Sheets
Diseño Profesional: Plantillas Confiables Y Estándares De La Industria
Predeterminadas Para Un Uso Rápido Y Eficiente
Compatible con MAC / PC, completamente desbloqueado
No Se Necesita Experiencia; Fáciles De Seguir
Reckitt Benckiser Group plc (RKT.L) Bundle
¿Buscas evaluar el valor intrínseco del PLC del Grupo Benckiser de Reckitt? Nuestra calculadora DCF (RKTL) integra datos del mundo real con capacidades integrales de personalización, lo que le permite refinar sus pronósticos y mejorar sus opciones de inversión.
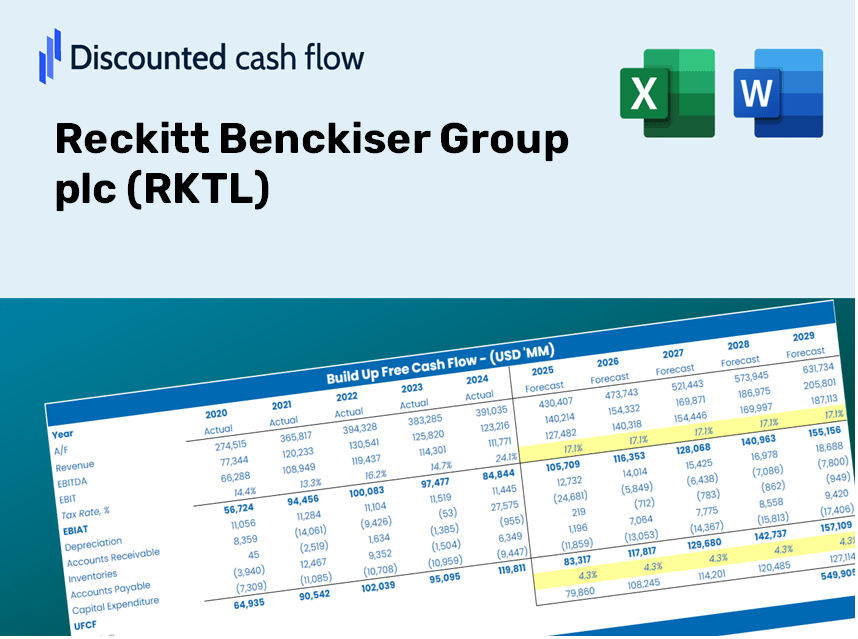
Discounted Cash Flow (DCF) - (USD MM)
| Year | AY1 2020 |
AY2 2021 |
AY3 2022 |
AY4 2023 |
AY5 2024 |
FY1 2025 |
FY2 2026 |
FY3 2027 |
FY4 2028 |
FY5 2029 |
|---|---|---|---|---|---|---|---|---|---|---|
| Revenue | 13,993.0 | 13,234.0 | 14,453.0 | 14,607.0 | 14,169.0 | 14,234.7 | 14,300.6 | 14,366.9 | 14,433.5 | 14,500.4 |
| Revenue Growth, % | 0 | -5.42 | 9.21 | 1.07 | -3 | 0.46349 | 0.46349 | 0.46349 | 0.46349 | 0.46349 |
| EBITDA | 3,485.0 | 465.0 | 3,904.0 | 3,189.0 | 2,950.0 | 2,792.4 | 2,805.3 | 2,818.3 | 2,831.4 | 2,844.5 |
| EBITDA, % | 24.91 | 3.51 | 27.01 | 21.83 | 20.82 | 19.62 | 19.62 | 19.62 | 19.62 | 19.62 |
| Depreciation | 470.0 | 429.0 | 604.0 | 470.0 | 461.0 | 491.1 | 493.4 | 495.7 | 498.0 | 500.3 |
| Depreciation, % | 3.36 | 3.24 | 4.18 | 3.22 | 3.25 | 3.45 | 3.45 | 3.45 | 3.45 | 3.45 |
| EBIT | 3,015.0 | 36.0 | 3,300.0 | 2,719.0 | 2,489.0 | 2,301.2 | 2,311.9 | 2,322.6 | 2,333.4 | 2,344.2 |
| EBIT, % | 21.55 | 0.27203 | 22.83 | 18.61 | 17.57 | 16.17 | 16.17 | 16.17 | 16.17 | 16.17 |
| Total Cash | 1,646.0 | 1,261.0 | 1,157.0 | 1,387.0 | 760.0 | 1,257.1 | 1,262.9 | 1,268.8 | 1,274.7 | 1,280.6 |
| Total Cash, percent | .0 | .0 | .0 | .0 | .0 | .0 | .0 | .0 | .0 | .0 |
| Account Receivables | 1,557.0 | 2,081.0 | 2,237.0 | 1,705.0 | 2,091.0 | 1,957.5 | 1,966.6 | 1,975.7 | 1,984.9 | 1,994.1 |
| Account Receivables, % | 11.13 | 15.72 | 15.48 | 11.67 | 14.76 | 13.75 | 13.75 | 13.75 | 13.75 | 13.75 |
| Inventories | 1,592.0 | 1,459.0 | 1,825.0 | 1,637.0 | 1,517.0 | 1,621.1 | 1,628.6 | 1,636.2 | 1,643.8 | 1,651.4 |
| Inventories, % | 11.38 | 11.02 | 12.63 | 11.21 | 10.71 | 11.39 | 11.39 | 11.39 | 11.39 | 11.39 |
| Accounts Payable | 2,159.0 | 2,064.0 | 2,366.0 | 2,194.0 | 2,268.0 | 2,232.6 | 2,243.0 | 2,253.4 | 2,263.8 | 2,274.3 |
| Accounts Payable, % | 15.43 | 15.6 | 16.37 | 15.02 | 16.01 | 15.68 | 15.68 | 15.68 | 15.68 | 15.68 |
| Capital Expenditure | -394.0 | -373.0 | -443.0 | -449.0 | -465.0 | -428.6 | -430.6 | -432.6 | -434.6 | -436.6 |
| Capital Expenditure, % | -2.82 | -2.82 | -3.07 | -3.07 | -3.28 | -3.01 | -3.01 | -3.01 | -3.01 | -3.01 |
| Tax Rate, % | 32.22 | 32.22 | 32.22 | 32.22 | 32.22 | 32.22 | 32.22 | 32.22 | 32.22 | 32.22 |
| EBITAT | 1,910.7 | 4.4 | 2,507.0 | 1,860.6 | 1,686.9 | 1,324.9 | 1,331.0 | 1,337.2 | 1,343.4 | 1,349.6 |
| Depreciation | ||||||||||
| Changes in Account Receivables | ||||||||||
| Changes in Inventories | ||||||||||
| Changes in Accounts Payable | ||||||||||
| Capital Expenditure | ||||||||||
| UFCF | 996.7 | -425.6 | 2,448.0 | 2,429.6 | 1,490.9 | 1,381.4 | 1,387.6 | 1,394.0 | 1,400.5 | 1,406.9 |
| WACC, % | 4.36 | 3.96 | 4.46 | 4.4 | 4.39 | 4.31 | 4.31 | 4.31 | 4.31 | 4.31 |
| PV UFCF | ||||||||||
| SUM PV UFCF | 6,149.2 | |||||||||
| Long Term Growth Rate, % | 2.00 | |||||||||
| Free cash flow (T + 1) | 1,435 | |||||||||
| Terminal Value | 61,996 | |||||||||
| Present Terminal Value | 50,192 | |||||||||
| Enterprise Value | 56,341 | |||||||||
| Net Debt | 7,898 | |||||||||
| Equity Value | 48,443 | |||||||||
| Diluted Shares Outstanding, MM | 702 | |||||||||
| Equity Value Per Share | 6,903.25 |
What You Will Receive
- Authentic RKTL Financial Data: Pre-loaded with Reckitt Benckiser’s historical and projected figures for accurate analysis.
- Fully Customizable Template: Easily adjust key inputs such as revenue growth, WACC, and EBITDA percentage.
- Instant Calculations: Observe real-time updates of Reckitt Benckiser’s intrinsic value as you make changes.
- Professional Valuation Tool: Tailored for investors, analysts, and consultants seeking reliable DCF evaluations.
- User-Friendly Interface: Intuitive layout and clear guidance suitable for all skill levels.
Key Features
- Real-Life RKTL Data: Pre-loaded with Reckitt Benckiser’s historical financial performance and future projections.
- Completely Customizable Inputs: Modify revenue growth, profit margins, discount rates, tax rates, and capital expenditures.
- Interactive Valuation Model: Automatically refreshes Net Present Value (NPV) and intrinsic value based on your adjustments.
- Scenario Analysis: Develop multiple forecasting scenarios to explore various valuation results.
- User-Friendly Interface: Intuitive, organized, and suitable for both professionals and novices.
How It Operates
- Download the Template: Gain immediate access to the Excel-based RKTL DCF Calculator.
- Input Your Assumptions: Modify the yellow-highlighted cells for factors such as growth rates, WACC, margins, and more.
- Instant Calculations: The model automatically refreshes Reckitt Benckiser’s intrinsic value.
- Test Scenarios: Explore various assumptions to assess potential changes in valuation.
- Analyze and Decide: Utilize the results to inform your investment or financial evaluations.
Why Choose This Calculator for Reckitt Benckiser Group plc (RKTL)?
- User-Friendly Interface: Perfectly crafted for both novice users and seasoned professionals.
- Customizable Inputs: Adjust parameters effortlessly to suit your analytical needs.
- Real-Time Updates: Witness immediate changes to Reckitt Benckiser’s valuation as you tweak inputs.
- Preconfigured Data: Comes with Reckitt Benckiser's actual financial metrics for swift analysis.
- Relied Upon by Experts: Favored by financial analysts and investors for informed decision-making.
Who Should Use This Product?
- Individual Investors: Gain valuable insights to make informed decisions regarding buying or selling Reckitt Benckiser Group plc (RKTL) stock.
- Financial Analysts: Enhance your valuation processes with comprehensive and ready-to-utilize financial models for Reckitt Benckiser Group plc (RKTL).
- Consultants: Provide clients with accurate and timely valuation insights related to Reckitt Benckiser Group plc (RKTL).
- Business Owners: Learn how large corporations like Reckitt Benckiser Group plc (RKTL) are valued, to inform your own business strategies.
- Finance Students: Master valuation techniques through practical applications and analysis of data from Reckitt Benckiser Group plc (RKTL).
Contents of the Template
- Pre-Filled DCF Model: Reckitt Benckiser Group plc’s (RKTL) financial data preloaded for immediate application.
- WACC Calculator: Comprehensive calculations for the Weighted Average Cost of Capital.
- Financial Ratios: Assess Reckitt Benckiser’s profitability, leverage, and operational efficiency.
- Editable Inputs: Modify assumptions such as growth rates, profit margins, and capital expenditures to suit your scenarios.
- Financial Statements: Annual and quarterly reports to facilitate in-depth analysis.
- Interactive Dashboard: Easily visualize essential valuation metrics and outcomes.
Disclaimer
All information, articles, and product details provided on this website are for general informational and educational purposes only. We do not claim any ownership over, nor do we intend to infringe upon, any trademarks, copyrights, logos, brand names, or other intellectual property mentioned or depicted on this site. Such intellectual property remains the property of its respective owners, and any references here are made solely for identification or informational purposes, without implying any affiliation, endorsement, or partnership.
We make no representations or warranties, express or implied, regarding the accuracy, completeness, or suitability of any content or products presented. Nothing on this website should be construed as legal, tax, investment, financial, medical, or other professional advice. In addition, no part of this site—including articles or product references—constitutes a solicitation, recommendation, endorsement, advertisement, or offer to buy or sell any securities, franchises, or other financial instruments, particularly in jurisdictions where such activity would be unlawful.
All content is of a general nature and may not address the specific circumstances of any individual or entity. It is not a substitute for professional advice or services. Any actions you take based on the information provided here are strictly at your own risk. You accept full responsibility for any decisions or outcomes arising from your use of this website and agree to release us from any liability in connection with your use of, or reliance upon, the content or products found herein.