
|
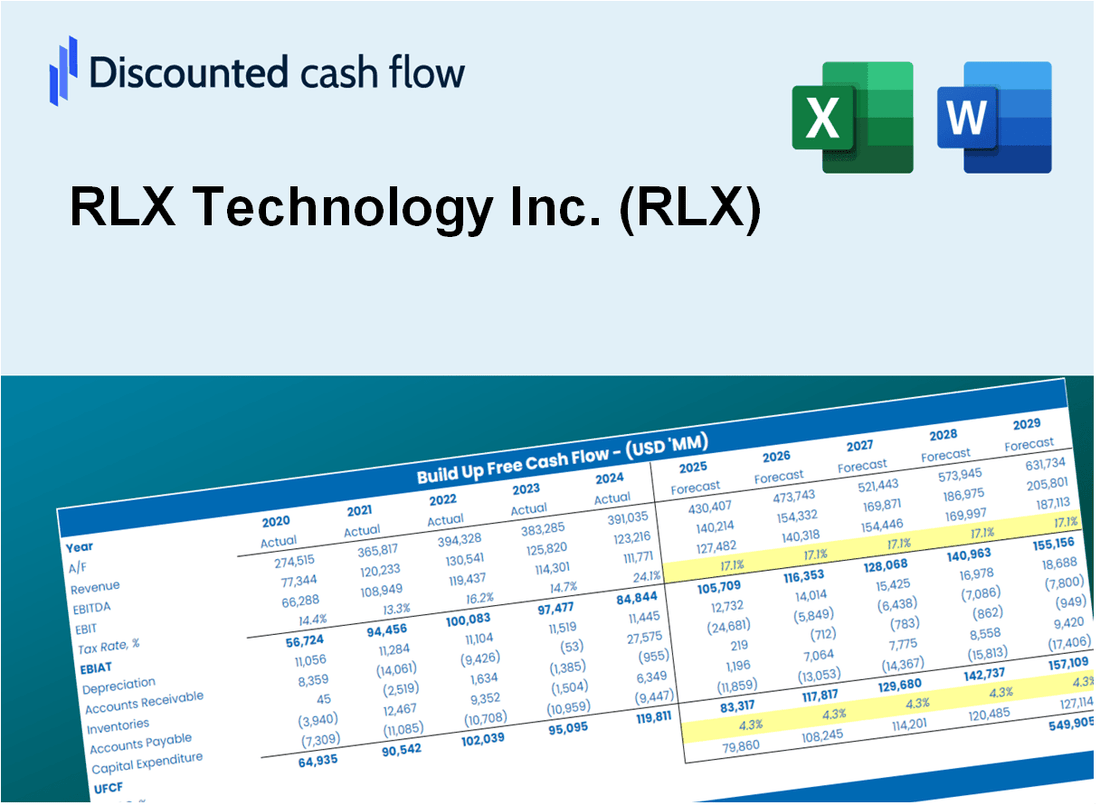
Valoración DCF de RLX Technology Inc. (RLX) |
Completamente Editable: Adáptelo A Sus Necesidades En Excel O Sheets
Diseño Profesional: Plantillas Confiables Y Estándares De La Industria
Predeterminadas Para Un Uso Rápido Y Eficiente
Compatible con MAC / PC, completamente desbloqueado
No Se Necesita Experiencia; Fáciles De Seguir
RLX Technology Inc. (RLX) Bundle
¡Optimice su tiempo y mejore la precisión con nuestra calculadora DCF (RLX)! Con el acceso a los datos de Real RLX Technology Inc. y supuestos personalizables, esta herramienta le permite pronosticar, analizar y valorar RLX como un inversor experimentado.
Discounted Cash Flow (DCF) - (USD MM)
| Year | AY1 2020 |
AY2 2021 |
AY3 2022 |
AY4 2023 |
AY5 2024 |
FY1 2025 |
FY2 2026 |
FY3 2027 |
FY4 2028 |
FY5 2029 |
|---|---|---|---|---|---|---|---|---|---|---|
| Revenue | 537.0 | 1,197.8 | 749.7 | 174.9 | 343.6 | 439.7 | 562.6 | 719.9 | 921.1 | 1,178.6 |
| Revenue Growth, % | 0 | 123.08 | -37.42 | -76.67 | 96.5 | 27.95 | 27.95 | 27.95 | 27.95 | 27.95 |
| EBITDA | 5.1 | 329.6 | 160.9 | -56.2 | -8.5 | 13.4 | 17.2 | 22.0 | 28.2 | 36.0 |
| EBITDA, % | 0.94813 | 27.51 | 21.47 | -32.16 | -2.48 | 3.06 | 3.06 | 3.06 | 3.06 | 3.06 |
| Depreciation | 3.2 | 6.4 | 11.4 | 13.6 | 6.5 | 10.8 | 13.9 | 17.8 | 22.7 | 29.1 |
| Depreciation, % | 0.60389 | 0.53561 | 1.53 | 7.77 | 1.9 | 2.47 | 2.47 | 2.47 | 2.47 | 2.47 |
| EBIT | 1.8 | 323.1 | 149.5 | -69.8 | -15.1 | 2.6 | 3.3 | 4.3 | 5.4 | 7.0 |
| EBIT, % | 0.34424 | 26.98 | 19.94 | -39.93 | -4.38 | 0.59043 | 0.59043 | 0.59043 | 0.59043 | 0.59043 |
| Total Cash | 433.1 | 1,806.8 | 1,516.6 | 1,140.7 | 1,193.9 | 422.7 | 540.8 | 692.0 | 885.5 | 1,133.0 |
| Total Cash, percent | .0 | .0 | .0 | .0 | .0 | .0 | .0 | .0 | .0 | .0 |
| Account Receivables | 7.7 | 3.7 | 8.4 | 23.2 | 79.6 | 34.5 | 44.2 | 56.5 | 72.3 | 92.5 |
| Account Receivables, % | 1.43 | 0.30473 | 1.12 | 13.24 | 23.16 | 7.85 | 7.85 | 7.85 | 7.85 | 7.85 |
| Inventories | 46.3 | 82.8 | 18.4 | 20.4 | 20.0 | 31.2 | 39.9 | 51.1 | 65.3 | 83.6 |
| Inventories, % | 8.62 | 6.91 | 2.45 | 11.64 | 5.83 | 7.09 | 7.09 | 7.09 | 7.09 | 7.09 |
| Accounts Payable | 75.3 | 71.1 | 7.4 | 15.4 | 41.5 | 36.8 | 47.1 | 60.2 | 77.1 | 98.6 |
| Accounts Payable, % | 14.03 | 5.94 | 0.98435 | 8.79 | 12.09 | 8.37 | 8.37 | 8.37 | 8.37 | 8.37 |
| Capital Expenditure | -2.5 | -19.5 | -5.4 | -4.6 | -1.7 | -5.2 | -6.7 | -8.5 | -10.9 | -13.9 |
| Capital Expenditure, % | -0.45695 | -1.63 | -0.72454 | -2.61 | -0.50165 | -1.18 | -1.18 | -1.18 | -1.18 | -1.18 |
| Tax Rate, % | 16.24 | 16.24 | 16.24 | 16.24 | 16.24 | 16.24 | 16.24 | 16.24 | 16.24 | 16.24 |
| EBITAT | -2.3 | 246.0 | 121.0 | -63.1 | -12.6 | 1.7 | 2.2 | 2.8 | 3.6 | 4.6 |
| Depreciation | ||||||||||
| Changes in Account Receivables | ||||||||||
| Changes in Inventories | ||||||||||
| Changes in Accounts Payable | ||||||||||
| Capital Expenditure | ||||||||||
| UFCF | 19.9 | 196.2 | 123.0 | -62.8 | -37.8 | 36.5 | 1.3 | 1.7 | 2.2 | 2.8 |
| WACC, % | 8.85 | 8.86 | 8.86 | 8.86 | 8.86 | 8.86 | 8.86 | 8.86 | 8.86 | 8.86 |
| PV UFCF | ||||||||||
| SUM PV UFCF | 39.4 | |||||||||
| Long Term Growth Rate, % | 4.00 | |||||||||
| Free cash flow (T + 1) | 3 | |||||||||
| Terminal Value | 60 | |||||||||
| Present Terminal Value | 39 | |||||||||
| Enterprise Value | 79 | |||||||||
| Net Debt | -778 | |||||||||
| Equity Value | 857 | |||||||||
| Diluted Shares Outstanding, MM | 1,289 | |||||||||
| Equity Value Per Share | 0.66 |
What You Will Receive
- Customizable Excel Template: A fully adjustable Excel-based DCF Calculator featuring pre-filled financials for RLX Technology Inc. (RLX).
- Authentic Data: Access to historical data and forward-looking projections (highlighted in the yellow cells).
- Flexible Forecasting: Modify forecast parameters such as revenue growth, EBITDA %, and WACC.
- Instant Calculations: Quickly observe how your inputs affect RLX’s valuation.
- Professional Resource: Designed for investors, CFOs, consultants, and financial analysts.
- Intuitive Layout: Organized for simplicity and user-friendliness, complete with step-by-step guidance.
Key Features
- 🔍 Real-Life RLX Financials: Pre-filled historical and projected data for RLX Technology Inc. (RLX).
- ✏️ Fully Customizable Inputs: Adjust all critical parameters (yellow cells) like WACC, growth %, and tax rates.
- 📊 Professional DCF Valuation: Built-in formulas calculate RLX’s intrinsic value using the Discounted Cash Flow method.
- ⚡ Instant Results: Visualize RLX’s valuation instantly after making changes.
- Scenario Analysis: Test and compare outcomes for various financial assumptions side-by-side.
How It Works
- Step 1: Download the prebuilt Excel template featuring RLX Technology Inc. (RLX) data.
- Step 2: Navigate through the pre-filled sheets to familiarize yourself with the essential metrics.
- Step 3: Modify forecasts and assumptions in the editable yellow cells (WACC, growth, margins).
- Step 4: Instantly view updated results, including RLX Technology Inc.'s (RLX) intrinsic value.
- Step 5: Utilize the outputs to make informed investment decisions or create detailed reports.
Why Choose This Calculator for RLX Technology Inc. (RLX)?
- Designed for Analysts: A sophisticated tool tailored for financial analysts, CFOs, and investment consultants.
- Comprehensive Data: RLX's historical and projected financials are preloaded for precision and reliability.
- Flexible Scenario Analysis: Effortlessly test various financial forecasts and assumptions.
- Insightful Outputs: Automatically computes intrinsic value, NPV, and other essential financial metrics.
- User-Friendly Interface: Step-by-step guidance ensures a smooth user experience throughout the calculation process.
Who Should Use This Product?
- Investors: Evaluate RLX Technology Inc. (RLX)’s market position before making investment decisions.
- CFOs and Financial Analysts: Enhance valuation methodologies and assess financial forecasts.
- Startup Founders: Understand the valuation strategies of leading tech companies like RLX Technology Inc. (RLX).
- Consultants: Provide comprehensive valuation analyses for clients in the tech sector.
- Students and Educators: Utilize RLX Technology Inc. (RLX) data for practical learning in valuation practices.
What the Template Contains
- Preloaded RLX Data: Historical and projected financial data, including revenue, EBIT, and capital expenditures.
- DCF and WACC Models: Professional-grade sheets for calculating intrinsic value and Weighted Average Cost of Capital.
- Editable Inputs: Yellow-highlighted cells for adjusting revenue growth, tax rates, and discount rates.
- Financial Statements: Comprehensive annual and quarterly financials for deeper analysis.
- Key Ratios: Profitability, leverage, and efficiency ratios to evaluate performance.
- Dashboard and Charts: Visual summaries of valuation outcomes and assumptions.
Disclaimer
All information, articles, and product details provided on this website are for general informational and educational purposes only. We do not claim any ownership over, nor do we intend to infringe upon, any trademarks, copyrights, logos, brand names, or other intellectual property mentioned or depicted on this site. Such intellectual property remains the property of its respective owners, and any references here are made solely for identification or informational purposes, without implying any affiliation, endorsement, or partnership.
We make no representations or warranties, express or implied, regarding the accuracy, completeness, or suitability of any content or products presented. Nothing on this website should be construed as legal, tax, investment, financial, medical, or other professional advice. In addition, no part of this site—including articles or product references—constitutes a solicitation, recommendation, endorsement, advertisement, or offer to buy or sell any securities, franchises, or other financial instruments, particularly in jurisdictions where such activity would be unlawful.
All content is of a general nature and may not address the specific circumstances of any individual or entity. It is not a substitute for professional advice or services. Any actions you take based on the information provided here are strictly at your own risk. You accept full responsibility for any decisions or outcomes arising from your use of this website and agree to release us from any liability in connection with your use of, or reliance upon, the content or products found herein.