
|
Valoración DCF de Rush Street Interactive, Inc. (RSI) |
Completamente Editable: Adáptelo A Sus Necesidades En Excel O Sheets
Diseño Profesional: Plantillas Confiables Y Estándares De La Industria
Predeterminadas Para Un Uso Rápido Y Eficiente
Compatible con MAC / PC, completamente desbloqueado
No Se Necesita Experiencia; Fáciles De Seguir
Rush Street Interactive, Inc. (RSI) Bundle
¡Descubra el verdadero potencial de Rush Street Interactive, Inc. (RSI) con nuestra calculadora DCF avanzada! Ajuste los supuestos críticos, explore varios escenarios y evalúe cómo las fluctuaciones afectan la valoración de Rush Street Interactive, Inc. (RSI), todo dentro de una plantilla completa de Excel.
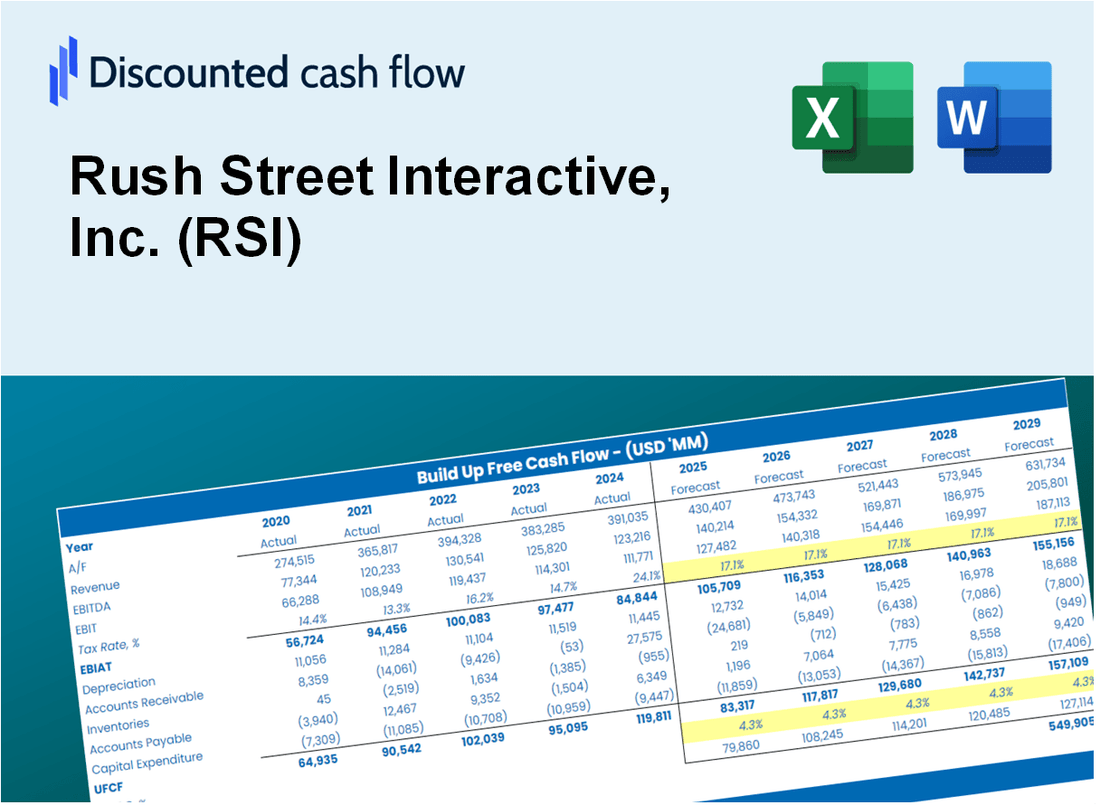
Discounted Cash Flow (DCF) - (USD MM)
| Year | AY1 2020 |
AY2 2021 |
AY3 2022 |
AY4 2023 |
AY5 2024 |
FY1 2025 |
FY2 2026 |
FY3 2027 |
FY4 2028 |
FY5 2029 |
|---|---|---|---|---|---|---|---|---|---|---|
| Revenue | 278.5 | 488.1 | 592.2 | 691.2 | 924.1 | 1,263.7 | 1,728.1 | 2,363.2 | 3,231.6 | 4,419.2 |
| Revenue Growth, % | 0 | 75.26 | 21.33 | 16.71 | 33.7 | 36.75 | 36.75 | 36.75 | 36.75 | 36.75 |
| EBITDA | -126.5 | -90.0 | -110.5 | -21.9 | 56.5 | -201.1 | -275.0 | -376.1 | -514.3 | -703.3 |
| EBITDA, % | -45.43 | -18.45 | -18.65 | -3.16 | 6.12 | -15.91 | -15.91 | -15.91 | -15.91 | -15.91 |
| Depreciation | 2.1 | 4.2 | 14.3 | 29.8 | 32.2 | 29.9 | 40.9 | 55.9 | 76.4 | 104.5 |
| Depreciation, % | 0.74758 | 0.86969 | 2.42 | 4.31 | 3.48 | 2.37 | 2.37 | 2.37 | 2.37 | 2.37 |
| EBIT | -128.6 | -94.3 | -124.8 | -51.6 | 24.3 | -231.0 | -315.9 | -432.0 | -590.7 | -807.8 |
| EBIT, % | -46.17 | -19.32 | -21.07 | -7.47 | 2.63 | -18.28 | -18.28 | -18.28 | -18.28 | -18.28 |
| Total Cash | 255.6 | 281.0 | 179.7 | 168.3 | 229.2 | 578.4 | 791.0 | 1,081.7 | 1,479.2 | 2,022.8 |
| Total Cash, percent | .0 | .0 | .0 | .0 | .0 | .0 | .0 | .0 | .0 | .0 |
| Account Receivables | 29.5 | 34.0 | 47.1 | 44.0 | 33.1 | 89.6 | 122.6 | 167.6 | 229.2 | 313.5 |
| Account Receivables, % | 10.61 | 6.96 | 7.95 | 6.36 | 3.58 | 7.09 | 7.09 | 7.09 | 7.09 | 7.09 |
| Inventories | .0 | .0 | .0 | .0 | .0 | .0 | .0 | .0 | .0 | .0 |
| Inventories, % | 0 | 0 | 0 | 0 | 0 | 0 | 0 | 0 | 0 | 0 |
| Accounts Payable | 12.0 | 6.5 | 29.8 | 32.3 | 25.8 | 45.9 | 62.7 | 85.7 | 117.3 | 160.4 |
| Accounts Payable, % | 4.31 | 1.33 | 5.03 | 4.68 | 2.79 | 3.63 | 3.63 | 3.63 | 3.63 | 3.63 |
| Capital Expenditure | -6.2 | -34.8 | -28.3 | -31.2 | -29.4 | -55.2 | -75.5 | -103.2 | -141.1 | -193.0 |
| Capital Expenditure, % | -2.24 | -7.12 | -4.78 | -4.51 | -3.18 | -4.37 | -4.37 | -4.37 | -4.37 | -4.37 |
| Tax Rate, % | 92.49 | 92.49 | 92.49 | 92.49 | 92.49 | 92.49 | 92.49 | 92.49 | 92.49 | 92.49 |
| EBITAT | 1.1 | -41.3 | -38.5 | -19.3 | 1.8 | -55.2 | -75.5 | -103.3 | -141.2 | -193.2 |
| Depreciation | ||||||||||
| Changes in Account Receivables | ||||||||||
| Changes in Inventories | ||||||||||
| Changes in Accounts Payable | ||||||||||
| Capital Expenditure | ||||||||||
| UFCF | -20.6 | -81.7 | -42.2 | -15.1 | 8.9 | -117.0 | -126.2 | -172.6 | -236.0 | -322.8 |
| WACC, % | 11.53 | 11.56 | 11.55 | 11.55 | 11.54 | 11.55 | 11.55 | 11.55 | 11.55 | 11.55 |
| PV UFCF | ||||||||||
| SUM PV UFCF | -670.1 | |||||||||
| Long Term Growth Rate, % | 2.00 | |||||||||
| Free cash flow (T + 1) | -329 | |||||||||
| Terminal Value | -3,449 | |||||||||
| Present Terminal Value | -1,997 | |||||||||
| Enterprise Value | -2,667 | |||||||||
| Net Debt | -225 | |||||||||
| Equity Value | -2,443 | |||||||||
| Diluted Shares Outstanding, MM | 88 | |||||||||
| Equity Value Per Share | -27.63 |
What You Will Get
- Real RSI Financials: Access to historical and forecasted data for precise valuation.
- Customizable Inputs: Adjust WACC, tax rates, revenue growth, and capital expenditures as needed.
- Dynamic Calculations: Intrinsic value and NPV are computed automatically.
- Scenario Analysis: Evaluate various scenarios to assess Rush Street Interactive’s future performance.
- User-Friendly Design: Designed for professionals but easy for beginners to navigate.
Key Features
- Customizable Financial Inputs: Adjust essential metrics such as gaming revenue growth, operating margin, and marketing expenditures.
- Instant DCF Valuation: Quickly computes intrinsic value, NPV, and additional financial metrics.
- High-Precision Results: Leverages Rush Street Interactive’s actual financial data for accurate valuation assessments.
- Effortless Scenario Analysis: Evaluate various scenarios and analyze results with ease.
- Efficiency Booster: Streamlines the valuation process, eliminating the need for intricate model development.
How It Works
- Step 1: Download the Excel file.
- Step 2: Review pre-entered Rush Street Interactive, Inc. (RSI) data (historical and projected).
- Step 3: Adjust key assumptions (yellow cells) based on your analysis.
- Step 4: View automatic recalculations for Rush Street Interactive, Inc.'s (RSI) intrinsic value.
- Step 5: Use the outputs for investment decisions or reporting.
Why Choose This Calculator for Rush Street Interactive, Inc. (RSI)?
- Designed for Industry Experts: A sophisticated tool tailored for analysts, CFOs, and industry consultants.
- Comprehensive Data: Rush Street Interactive’s historical and projected financials are preloaded for enhanced precision.
- Flexible Scenario Analysis: Effortlessly test various forecasts and assumptions to see potential outcomes.
- Insightful Results: Automatically computes intrinsic value, NPV, and other critical financial metrics.
- User-Friendly Interface: Step-by-step guidance makes the process straightforward and accessible.
Who Should Use This Product?
- Investors: Evaluate Rush Street Interactive, Inc.’s (RSI) market position before making investment decisions.
- CFOs and Financial Analysts: Optimize valuation methodologies and assess financial forecasts.
- Startup Founders: Gain insights into how established gaming companies like Rush Street Interactive, Inc. (RSI) are valued.
- Consultants: Provide in-depth valuation analyses and reports for clients in the gaming sector.
- Students and Educators: Utilize current data to learn and teach valuation strategies in the gaming industry.
What the Template Contains
- Comprehensive DCF Model: Editable template featuring detailed valuation calculations tailored for Rush Street Interactive, Inc. (RSI).
- Real-World Data: Historical and projected financials for Rush Street Interactive, Inc. (RSI) preloaded for thorough analysis.
- Customizable Parameters: Modify WACC, growth rates, and tax assumptions to explore various scenarios.
- Financial Statements: Complete annual and quarterly breakdowns to gain deeper insights into Rush Street Interactive, Inc. (RSI).
- Key Ratios: Integrated analysis for profitability, efficiency, and leverage specific to Rush Street Interactive, Inc. (RSI).
- Dashboard with Visual Outputs: Charts and tables designed for clear, actionable results for Rush Street Interactive, Inc. (RSI).
Disclaimer
All information, articles, and product details provided on this website are for general informational and educational purposes only. We do not claim any ownership over, nor do we intend to infringe upon, any trademarks, copyrights, logos, brand names, or other intellectual property mentioned or depicted on this site. Such intellectual property remains the property of its respective owners, and any references here are made solely for identification or informational purposes, without implying any affiliation, endorsement, or partnership.
We make no representations or warranties, express or implied, regarding the accuracy, completeness, or suitability of any content or products presented. Nothing on this website should be construed as legal, tax, investment, financial, medical, or other professional advice. In addition, no part of this site—including articles or product references—constitutes a solicitation, recommendation, endorsement, advertisement, or offer to buy or sell any securities, franchises, or other financial instruments, particularly in jurisdictions where such activity would be unlawful.
All content is of a general nature and may not address the specific circumstances of any individual or entity. It is not a substitute for professional advice or services. Any actions you take based on the information provided here are strictly at your own risk. You accept full responsibility for any decisions or outcomes arising from your use of this website and agree to release us from any liability in connection with your use of, or reliance upon, the content or products found herein.