
|
Valoración DCF de Safehold Inc. (SAFE) |
Completamente Editable: Adáptelo A Sus Necesidades En Excel O Sheets
Diseño Profesional: Plantillas Confiables Y Estándares De La Industria
Predeterminadas Para Un Uso Rápido Y Eficiente
Compatible con MAC / PC, completamente desbloqueado
No Se Necesita Experiencia; Fáciles De Seguir
Safehold Inc. (SAFE) Bundle
¡Evalúe las perspectivas financieras (seguras) de Safehold Inc. con precisión experta! Esta calculadora DCF (segura) proporciona datos financieros preconidos junto con la flexibilidad para modificar el crecimiento de los ingresos, WACC, los márgenes y otros supuestos esenciales para alinearse con sus predicciones.
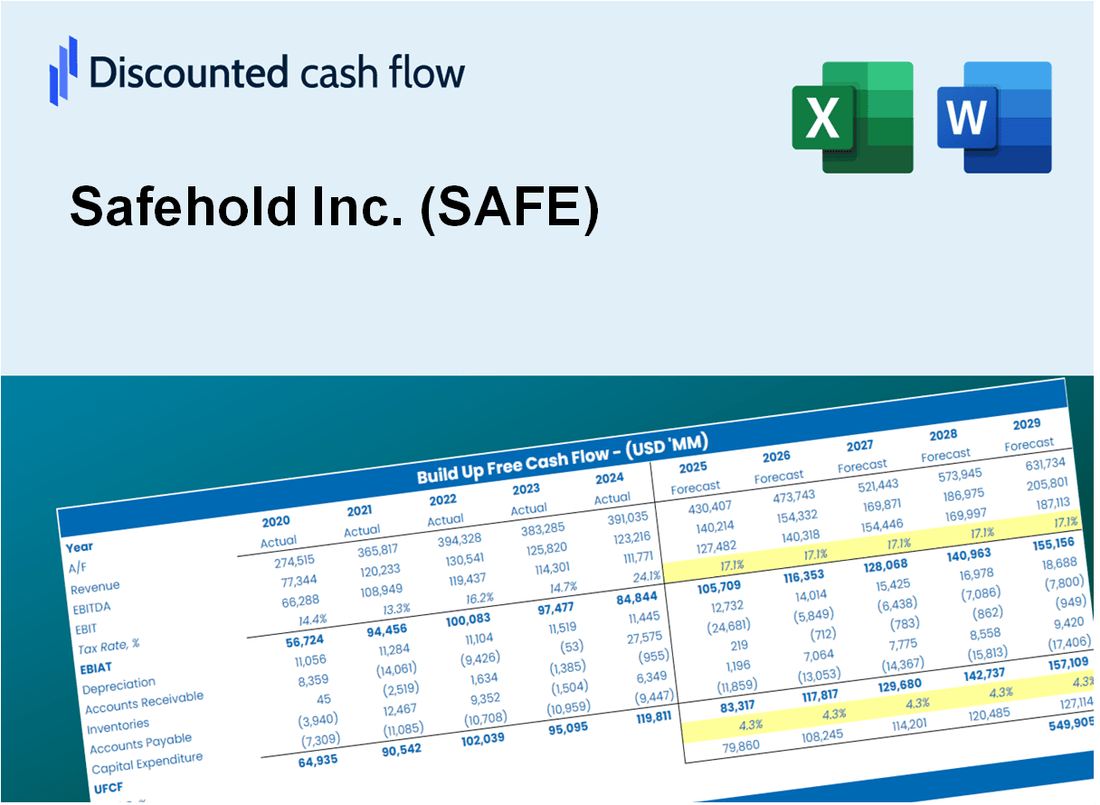
Discounted Cash Flow (DCF) - (USD MM)
| Year | AY1 2020 |
AY2 2021 |
AY3 2022 |
AY4 2023 |
AY5 2024 |
FY1 2025 |
FY2 2026 |
FY3 2027 |
FY4 2028 |
FY5 2029 |
|---|---|---|---|---|---|---|---|---|---|---|
| Revenue | 158.7 | 187.0 | 270.3 | 352.6 | 365.7 | 453.9 | 563.4 | 699.4 | 868.1 | 1,077.6 |
| Revenue Growth, % | 0 | 17.82 | 44.54 | 30.43 | 3.72 | 24.13 | 24.13 | 24.13 | 24.13 | 24.13 |
| EBITDA | 135.9 | 165.1 | 285.6 | 140.4 | 320.4 | 364.3 | 452.2 | 561.3 | 696.8 | 864.9 |
| EBITDA, % | 85.63 | 88.26 | 105.64 | 39.82 | 87.61 | 80.26 | 80.26 | 80.26 | 80.26 | 80.26 |
| Depreciation | 12.1 | 12.0 | 11.9 | 12.2 | 12.3 | 22.9 | 28.5 | 35.3 | 43.8 | 54.4 |
| Depreciation, % | 7.61 | 6.41 | 4.41 | 3.47 | 3.35 | 5.05 | 5.05 | 5.05 | 5.05 | 5.05 |
| EBIT | 123.8 | 153.1 | 273.7 | 128.2 | 308.1 | 345.4 | 428.7 | 532.2 | 660.6 | 820.0 |
| EBIT, % | 78.02 | 81.85 | 101.24 | 36.35 | 84.25 | 76.09 | 76.09 | 76.09 | 76.09 | 76.09 |
| Total Cash | 56.9 | 29.6 | 20.1 | 28.5 | 15.6 | 64.9 | 80.5 | 100.0 | 124.1 | 154.0 |
| Total Cash, percent | .0 | .0 | .0 | .0 | .0 | .0 | .0 | .0 | .0 | .0 |
| Account Receivables | 1,976.3 | 913.6 | 1,523.6 | 1,914.4 | 2,156.5 | 453.9 | 563.4 | 699.4 | 868.1 | 1,077.6 |
| Account Receivables, % | 1245.05 | 488.5 | 563.64 | 542.98 | 589.72 | 100 | 100 | 100 | 100 | 100 |
| Inventories | 5.2 | .0 | .0 | .0 | .0 | 3.0 | 3.7 | 4.6 | 5.7 | 7.1 |
| Inventories, % | 3.28 | 0 | 0 | 0 | 0 | 0.65671 | 0.65671 | 0.65671 | 0.65671 | 0.65671 |
| Accounts Payable | .0 | .0 | .0 | .0 | .0 | .0 | .0 | .0 | .0 | .0 |
| Accounts Payable, % | 0 | 0 | 0 | 0 | 0 | 0 | 0 | 0 | 0 | 0 |
| Capital Expenditure | -56.8 | -1,248.0 | -23.1 | -7.2 | .0 | -132.8 | -164.9 | -204.7 | -254.1 | -315.4 |
| Capital Expenditure, % | -35.75 | -667.32 | -8.53 | -2.06 | 0 | -29.27 | -29.27 | -29.27 | -29.27 | -29.27 |
| Tax Rate, % | 3.9 | 3.9 | 3.9 | 3.9 | 3.9 | 3.9 | 3.9 | 3.9 | 3.9 | 3.9 |
| EBITAT | 123.4 | 152.6 | 256.1 | 133.3 | 296.1 | 337.8 | 419.4 | 520.5 | 646.1 | 802.0 |
| Depreciation | ||||||||||
| Changes in Account Receivables | ||||||||||
| Changes in Inventories | ||||||||||
| Changes in Accounts Payable | ||||||||||
| Capital Expenditure | ||||||||||
| UFCF | -1,902.7 | -15.5 | -365.0 | -252.5 | 66.2 | 1,927.5 | 172.7 | 214.3 | 266.0 | 330.2 |
| WACC, % | 6.09 | 6.09 | 5.86 | 6.1 | 5.96 | 6.02 | 6.02 | 6.02 | 6.02 | 6.02 |
| PV UFCF | ||||||||||
| SUM PV UFCF | 2,608.6 | |||||||||
| Long Term Growth Rate, % | 2.00 | |||||||||
| Free cash flow (T + 1) | 337 | |||||||||
| Terminal Value | 8,376 | |||||||||
| Present Terminal Value | 6,253 | |||||||||
| Enterprise Value | 8,862 | |||||||||
| Net Debt | 4,219 | |||||||||
| Equity Value | 4,642 | |||||||||
| Diluted Shares Outstanding, MM | 71 | |||||||||
| Equity Value Per Share | 64.97 |
What You Will Receive
- Authentic SAFE Financial Data: Pre-loaded with Safehold Inc.'s historical and forecasted data for thorough analysis.
- Completely Customizable Template: Easily adjust key metrics such as revenue growth, WACC, and EBITDA %.
- Instant Calculations: Watch Safehold Inc.'s intrinsic value update in real-time as you make adjustments.
- Expert Valuation Tool: Crafted for investors, analysts, and consultants aiming for precise DCF outcomes.
- Intuitive Design: Straightforward layout and clear guidance suitable for all skill levels.
Key Features
- Customizable Investment Metrics: Adjust essential factors such as rental income growth, cap rate, and operating expenses.
- Instant DCF Analysis: Quickly determines intrinsic value, NPV, and additional financial metrics.
- High-Precision Valuation: Leverages Safehold Inc.'s (SAFE) actual financial data for accurate valuation results.
- Effortless Scenario Testing: Easily evaluate various assumptions and assess different outcomes.
- Efficiency Booster: Streamlines the valuation process, removing the need for complex model construction.
How It Works
- Step 1: Download the Excel file.
- Step 2: Review pre-entered Safehold Inc. (SAFE) data (historical and projected).
- Step 3: Adjust key assumptions (yellow cells) based on your analysis.
- Step 4: View automatic recalculations for Safehold Inc.'s (SAFE) intrinsic value.
- Step 5: Use the outputs for investment decisions or reporting.
Why Choose This Calculator for Safehold Inc. (SAFE)?
- Accurate Data: Utilizes real Safehold Inc. financials for trustworthy valuation outcomes.
- Customizable: Modify essential parameters like growth rates, WACC, and tax rates to align with your forecasts.
- Time-Saving: Pre-configured calculations save you the effort of starting from the ground up.
- Professional-Grade Tool: Tailored for investors, analysts, and consultants in the industry.
- User-Friendly: Easy-to-navigate design and clear instructions make it accessible for all users.
Who Should Use Safehold Inc. (SAFE)?
- Real Estate Students: Explore innovative land lease models and apply them to real-world scenarios.
- Researchers: Utilize Safehold's data for studies on land use and urban development trends.
- Investors: Evaluate your investment strategies by analyzing the performance of Safehold Inc. (SAFE).
- Financial Analysts: Enhance your analysis with a comprehensive understanding of Safehold's business model.
- Property Developers: Learn from Safehold's approach to land leasing and its impact on real estate projects.
What the Template Contains
- Pre-Filled Data: Contains Safehold Inc.'s historical financials and projections.
- Discounted Cash Flow Model: Editable DCF valuation model featuring automatic calculations.
- Weighted Average Cost of Capital (WACC): A specific sheet for calculating WACC using custom inputs.
- Key Financial Ratios: Evaluate Safehold Inc.'s profitability, efficiency, and leverage.
- Customizable Inputs: Easily adjust revenue growth, margins, and tax rates.
- Clear Dashboard: Visuals and tables summarizing essential valuation outcomes.
Disclaimer
All information, articles, and product details provided on this website are for general informational and educational purposes only. We do not claim any ownership over, nor do we intend to infringe upon, any trademarks, copyrights, logos, brand names, or other intellectual property mentioned or depicted on this site. Such intellectual property remains the property of its respective owners, and any references here are made solely for identification or informational purposes, without implying any affiliation, endorsement, or partnership.
We make no representations or warranties, express or implied, regarding the accuracy, completeness, or suitability of any content or products presented. Nothing on this website should be construed as legal, tax, investment, financial, medical, or other professional advice. In addition, no part of this site—including articles or product references—constitutes a solicitation, recommendation, endorsement, advertisement, or offer to buy or sell any securities, franchises, or other financial instruments, particularly in jurisdictions where such activity would be unlawful.
All content is of a general nature and may not address the specific circumstances of any individual or entity. It is not a substitute for professional advice or services. Any actions you take based on the information provided here are strictly at your own risk. You accept full responsibility for any decisions or outcomes arising from your use of this website and agree to release us from any liability in connection with your use of, or reliance upon, the content or products found herein.