
|
Valoración DCF de The Boston Beer Company, Inc. (SAM) |
Completamente Editable: Adáptelo A Sus Necesidades En Excel O Sheets
Diseño Profesional: Plantillas Confiables Y Estándares De La Industria
Predeterminadas Para Un Uso Rápido Y Eficiente
Compatible con MAC / PC, completamente desbloqueado
No Se Necesita Experiencia; Fáciles De Seguir
The Boston Beer Company, Inc. (SAM) Bundle
¡Descubra el verdadero valor de Boston Beer Company, Inc. (SAM) con nuestra calculadora DCF avanzada! Ajuste los supuestos clave, explore varios escenarios y examine cómo los cambios afectan la valoración de Boston Beer Company, Inc. (SAM), todo dentro de una plantilla de Excel integral.
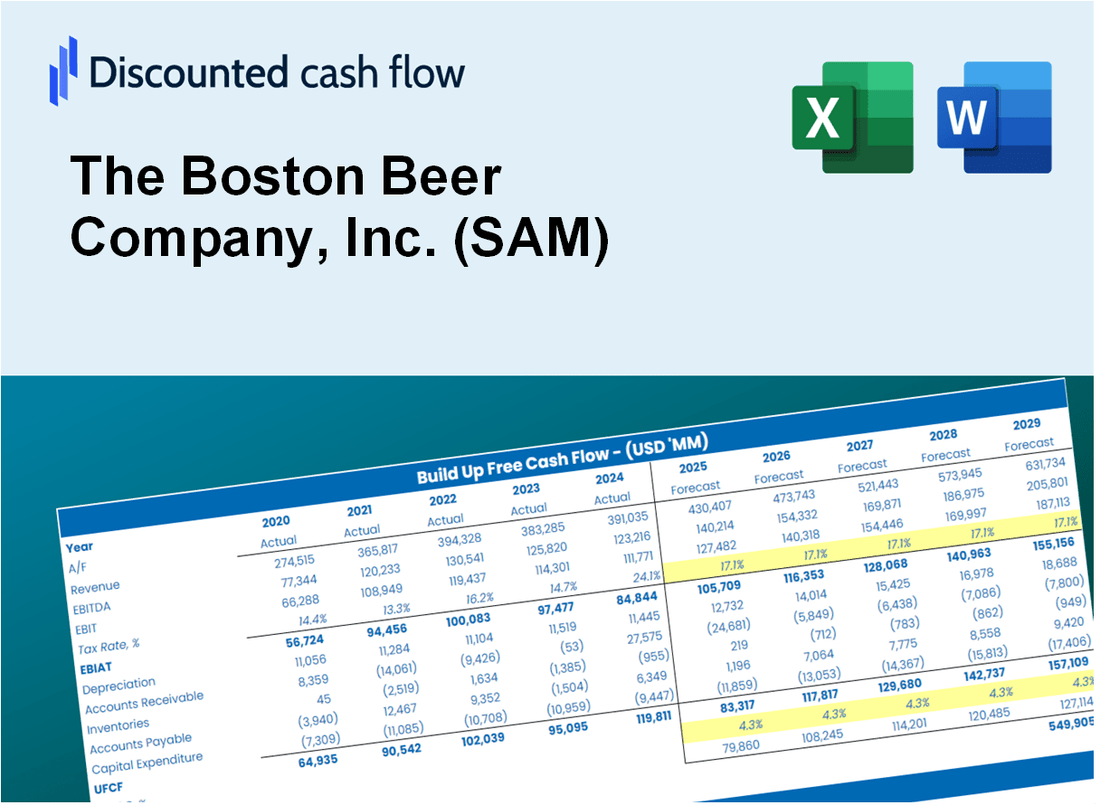
Discounted Cash Flow (DCF) - (USD MM)
| Year | AY1 2020 |
AY2 2021 |
AY3 2022 |
AY4 2023 |
AY5 2024 |
FY1 2025 |
FY2 2026 |
FY3 2027 |
FY4 2028 |
FY5 2029 |
|---|---|---|---|---|---|---|---|---|---|---|
| Revenue | 1,736.4 | 2,057.6 | 2,090.3 | 2,008.6 | 2,012.9 | 2,095.4 | 2,181.3 | 2,270.7 | 2,363.7 | 2,460.6 |
| Revenue Growth, % | 0 | 18.5 | 1.59 | -3.91 | 0.21413 | 4.1 | 4.1 | 4.1 | 4.1 | 4.1 |
| EBITDA | 314.3 | 129.3 | 207.4 | 210.0 | 245.8 | 238.8 | 248.5 | 258.7 | 269.3 | 280.4 |
| EBITDA, % | 18.1 | 6.28 | 9.92 | 10.45 | 12.21 | 11.39 | 11.39 | 11.39 | 11.39 | 11.39 |
| Depreciation | 65.7 | 72.1 | 81.4 | 88.1 | 94.0 | 84.8 | 88.3 | 91.9 | 95.7 | 99.6 |
| Depreciation, % | 3.78 | 3.5 | 3.89 | 4.39 | 4.67 | 4.05 | 4.05 | 4.05 | 4.05 | 4.05 |
| EBIT | 248.7 | 57.2 | 126.1 | 121.8 | 151.8 | 154.0 | 160.3 | 166.8 | 173.7 | 180.8 |
| EBIT, % | 14.32 | 2.78 | 6.03 | 6.06 | 7.54 | 7.35 | 7.35 | 7.35 | 7.35 | 7.35 |
| Total Cash | 163.3 | 26.9 | 180.6 | 298.5 | 211.8 | 187.5 | 195.1 | 203.1 | 211.5 | 220.1 |
| Total Cash, percent | .0 | .0 | .0 | .0 | .0 | .0 | .0 | .0 | .0 | .0 |
| Account Receivables | 88.8 | 108.4 | 66.8 | 68.7 | 68.1 | 85.4 | 88.9 | 92.6 | 96.3 | 100.3 |
| Account Receivables, % | 5.11 | 5.27 | 3.2 | 3.42 | 3.38 | 4.08 | 4.08 | 4.08 | 4.08 | 4.08 |
| Inventories | 130.9 | 153.9 | 148.5 | 115.8 | 117.2 | 141.3 | 147.0 | 153.1 | 159.3 | 165.9 |
| Inventories, % | 7.54 | 7.48 | 7.1 | 5.76 | 5.82 | 6.74 | 6.74 | 6.74 | 6.74 | 6.74 |
| Accounts Payable | 121.6 | 85.9 | 84.2 | 87.2 | 87.3 | 100.1 | 104.2 | 108.5 | 112.9 | 117.6 |
| Accounts Payable, % | 7.01 | 4.18 | 4.03 | 4.34 | 4.34 | 4.78 | 4.78 | 4.78 | 4.78 | 4.78 |
| Capital Expenditure | -140.0 | -147.9 | -90.6 | -64.1 | -76.3 | -111.3 | -115.9 | -120.6 | -125.6 | -130.7 |
| Capital Expenditure, % | -8.06 | -7.19 | -4.33 | -3.19 | -3.79 | -5.31 | -5.31 | -5.31 | -5.31 | -5.31 |
| Tax Rate, % | 31.86 | 31.86 | 31.86 | 31.86 | 31.86 | 31.86 | 31.86 | 31.86 | 31.86 | 31.86 |
| EBITAT | 195.5 | 120.4 | 92.7 | 84.8 | 103.4 | 120.0 | 125.0 | 130.1 | 135.4 | 141.0 |
| Depreciation | ||||||||||
| Changes in Account Receivables | ||||||||||
| Changes in Inventories | ||||||||||
| Changes in Accounts Payable | ||||||||||
| Capital Expenditure | ||||||||||
| UFCF | 23.1 | -33.8 | 128.9 | 142.6 | 120.4 | 65.0 | 92.2 | 95.9 | 99.9 | 104.0 |
| WACC, % | 8.63 | 8.64 | 8.63 | 8.62 | 8.62 | 8.63 | 8.63 | 8.63 | 8.63 | 8.63 |
| PV UFCF | ||||||||||
| SUM PV UFCF | 353.2 | |||||||||
| Long Term Growth Rate, % | 3.50 | |||||||||
| Free cash flow (T + 1) | 108 | |||||||||
| Terminal Value | 2,098 | |||||||||
| Present Terminal Value | 1,387 | |||||||||
| Enterprise Value | 1,740 | |||||||||
| Net Debt | -173 | |||||||||
| Equity Value | 1,913 | |||||||||
| Diluted Shares Outstanding, MM | 12 | |||||||||
| Equity Value Per Share | 162.49 |
What You Will Get
- Editable Forecast Inputs: Easily modify key assumptions (growth %, margins, WACC) to explore various scenarios.
- Real-World Data: The Boston Beer Company’s financial data pre-loaded to facilitate your analysis.
- Automatic DCF Outputs: The template computes Net Present Value (NPV) and intrinsic value automatically.
- Customizable and Professional: A refined Excel model that adjusts to your valuation requirements.
- Built for Analysts and Investors: Perfect for evaluating projections, validating strategies, and enhancing efficiency.
Key Features
- Customizable Growth Metrics: Adjust essential inputs such as sales growth, profit margins, and marketing expenses.
- Instant DCF Analysis: Quickly computes intrinsic value, NPV, and additional financial metrics.
- Industry-Leading Precision: Incorporates The Boston Beer Company's actual financial data for accurate valuation results.
- Effortless Scenario Testing: Evaluate various assumptions and analyze results with ease.
- Efficiency Booster: Streamlines the valuation process, removing the need for intricate model development.
How It Works
- 1. Access the Template: Download and open the Excel file featuring The Boston Beer Company, Inc. (SAM)'s preloaded data.
- 2. Modify Assumptions: Adjust key inputs such as growth rates, WACC, and capital expenditures.
- 3. Analyze Results Instantly: The DCF model automatically computes intrinsic value and NPV.
- 4. Explore Scenarios: Evaluate various forecasts to assess different valuation outcomes.
- 5. Present with Confidence: Deliver professional valuation insights to back your decisions.
Why Choose This Calculator for The Boston Beer Company, Inc. (SAM)?
- Accuracy: Utilizes real financial data from The Boston Beer Company for precise calculations.
- Flexibility: Allows users to easily adjust and test various input parameters.
- Time-Saving: Eliminate the need to create a financial model from the ground up.
- Professional-Grade: Crafted with the expertise and precision expected at the CFO level.
- User-Friendly: Intuitive interface suitable for users with varying levels of financial modeling skills.
Who Should Use This Product?
- Investors: Make informed investment choices with insights from a leading craft brewery.
- Market Analysts: Analyze trends and performance metrics specific to the beverage industry.
- Consultants: Tailor presentations for clients in the food and beverage sector using detailed data.
- Brewery Enthusiasts: Gain a deeper appreciation of craft brewing and its market dynamics.
- Educators and Students: Utilize resources for hands-on learning in business and marketing courses.
What the Template Contains
- Preloaded SAM Data: Historical and projected financial data, including revenue, EBIT, and capital expenditures.
- DCF and WACC Models: Professional-grade sheets for calculating intrinsic value and Weighted Average Cost of Capital.
- Editable Inputs: Yellow-highlighted cells for adjusting revenue growth, tax rates, and discount rates.
- Financial Statements: Comprehensive annual and quarterly financials for deeper analysis.
- Key Ratios: Profitability, leverage, and efficiency ratios to evaluate performance.
- Dashboard and Charts: Visual summaries of valuation outcomes and assumptions.
Disclaimer
All information, articles, and product details provided on this website are for general informational and educational purposes only. We do not claim any ownership over, nor do we intend to infringe upon, any trademarks, copyrights, logos, brand names, or other intellectual property mentioned or depicted on this site. Such intellectual property remains the property of its respective owners, and any references here are made solely for identification or informational purposes, without implying any affiliation, endorsement, or partnership.
We make no representations or warranties, express or implied, regarding the accuracy, completeness, or suitability of any content or products presented. Nothing on this website should be construed as legal, tax, investment, financial, medical, or other professional advice. In addition, no part of this site—including articles or product references—constitutes a solicitation, recommendation, endorsement, advertisement, or offer to buy or sell any securities, franchises, or other financial instruments, particularly in jurisdictions where such activity would be unlawful.
All content is of a general nature and may not address the specific circumstances of any individual or entity. It is not a substitute for professional advice or services. Any actions you take based on the information provided here are strictly at your own risk. You accept full responsibility for any decisions or outcomes arising from your use of this website and agree to release us from any liability in connection with your use of, or reliance upon, the content or products found herein.