
|
Santander UK PLC (SANB.L) DCF Valoración |
Completamente Editable: Adáptelo A Sus Necesidades En Excel O Sheets
Diseño Profesional: Plantillas Confiables Y Estándares De La Industria
Predeterminadas Para Un Uso Rápido Y Eficiente
Compatible con MAC / PC, completamente desbloqueado
No Se Necesita Experiencia; Fáciles De Seguir
Santander UK plc (SANB.L) Bundle
¡Evalúa las perspectivas financieras de Santander UK PLC como un experto! Esta calculadora DCF (SANBL) ofrece datos financieros previamente poblados y la flexibilidad para modificar el crecimiento de los ingresos, WACC, los márgenes y otros supuestos esenciales para alinearse con sus proyecciones.
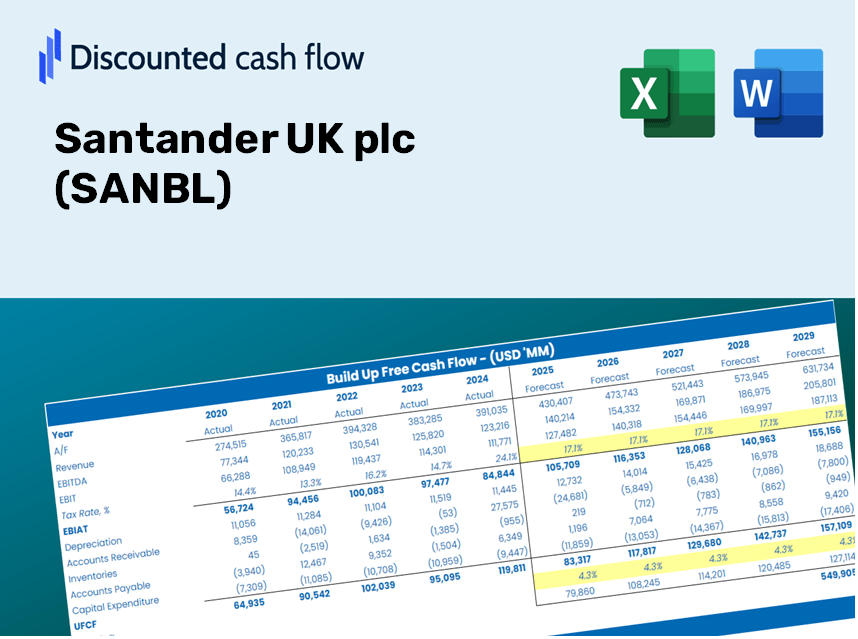
Discounted Cash Flow (DCF) - (USD MM)
| Year | AY1 2020 |
AY2 2021 |
AY3 2022 |
AY4 2023 |
AY5 2024 |
FY1 2025 |
FY2 2026 |
FY3 2027 |
FY4 2028 |
FY5 2029 |
|---|---|---|---|---|---|---|---|---|---|---|
| Revenue | 3,852.0 | 5,239.0 | 7,239.0 | 12,055.0 | 12,784.0 | 17,474.4 | 23,885.7 | 32,649.2 | 44,628.1 | 61,002.0 |
| Revenue Growth, % | 0 | 36.01 | 38.18 | 66.53 | 6.05 | 36.69 | 36.69 | 36.69 | 36.69 | 36.69 |
| EBITDA | .0 | 2,346.0 | 2,170.0 | 2,390.0 | 1,649.0 | 3,756.3 | 5,134.5 | 7,018.3 | 9,593.3 | 13,113.1 |
| EBITDA, % | 0 | 44.78 | 29.98 | 19.83 | 12.9 | 21.5 | 21.5 | 21.5 | 21.5 | 21.5 |
| Depreciation | 562.0 | 501.0 | 296.0 | 290.0 | 300.0 | 1,153.1 | 1,576.2 | 2,154.5 | 2,944.9 | 4,025.4 |
| Depreciation, % | 14.59 | 9.56 | 4.09 | 2.41 | 2.35 | 6.6 | 6.6 | 6.6 | 6.6 | 6.6 |
| EBIT | -562.0 | 1,845.0 | 1,874.0 | 2,100.0 | 1,349.0 | 2,603.2 | 3,558.3 | 4,863.9 | 6,648.4 | 9,087.7 |
| EBIT, % | -14.59 | 35.22 | 25.89 | 17.42 | 10.55 | 14.9 | 14.9 | 14.9 | 14.9 | 14.9 |
| Total Cash | 50,179.0 | 53,972.0 | 50,214.0 | 46,695.0 | 38,921.0 | 17,474.4 | 23,885.7 | 32,649.2 | 44,628.1 | 61,002.0 |
| Total Cash, percent | .0 | .0 | .0 | .0 | .0 | .0 | .0 | .0 | .0 | .0 |
| Account Receivables | 6,764.0 | 4,238.0 | 5,101.0 | 4,999.0 | 4,705.0 | 11,520.2 | 15,746.9 | 21,524.4 | 29,421.6 | 40,216.3 |
| Account Receivables, % | 175.6 | 80.89 | 70.47 | 41.47 | 36.8 | 65.93 | 65.93 | 65.93 | 65.93 | 65.93 |
| Inventories | .0 | .0 | .0 | .0 | .0 | .0 | .0 | .0 | .0 | .0 |
| Inventories, % | 0 | 0 | 0 | 0 | 0 | 0 | 0 | 0 | 0 | 0 |
| Accounts Payable | .0 | .0 | .0 | .0 | .0 | .0 | .0 | .0 | .0 | .0 |
| Accounts Payable, % | 0 | 0 | 0 | 0 | 0 | 0 | 0 | 0 | 0 | 0 |
| Capital Expenditure | -373.0 | -613.0 | -496.0 | -385.0 | -528.0 | -1,242.8 | -1,698.7 | -2,322.0 | -3,173.9 | -4,338.4 |
| Capital Expenditure, % | -9.68 | -11.7 | -6.85 | -3.19 | -4.13 | -7.11 | -7.11 | -7.11 | -7.11 | -7.11 |
| Tax Rate, % | 28.02 | 28.02 | 28.02 | 28.02 | 28.02 | 28.02 | 28.02 | 28.02 | 28.02 | 28.02 |
| EBITAT | -419.9 | 1,365.0 | 1,394.0 | 1,541.0 | 971.0 | 1,918.3 | 2,622.1 | 3,584.1 | 4,899.1 | 6,696.5 |
| Depreciation | ||||||||||
| Changes in Account Receivables | ||||||||||
| Changes in Inventories | ||||||||||
| Changes in Accounts Payable | ||||||||||
| Capital Expenditure | ||||||||||
| UFCF | -6,994.9 | 3,779.0 | 331.0 | 1,548.0 | 1,037.0 | -4,986.6 | -1,727.2 | -2,360.9 | -3,227.1 | -4,411.1 |
| WACC, % | 12.01 | 11.92 | 11.97 | 11.84 | 11.66 | 11.88 | 11.88 | 11.88 | 11.88 | 11.88 |
| PV UFCF | ||||||||||
| SUM PV UFCF | -12,099.2 | |||||||||
| Long Term Growth Rate, % | 2.00 | |||||||||
| Free cash flow (T + 1) | -4,499 | |||||||||
| Terminal Value | -45,544 | |||||||||
| Present Terminal Value | -25,982 | |||||||||
| Enterprise Value | -38,082 | |||||||||
| Net Debt | 8,372 | |||||||||
| Equity Value | -46,454 | |||||||||
| Diluted Shares Outstanding, MM | 16,776 | |||||||||
| Equity Value Per Share | -276.90 |
What You Will Receive
- Genuine SANBL Financial Data: Pre-filled with Santander UK’s historical and projected data for accurate analysis.
- Customizable Template: Easily adjust key inputs such as revenue growth, WACC, and EBITDA %.
- Instant Calculations: Watch as Santander UK's intrinsic value updates in real-time with your modifications.
- Expert Valuation Tool: Tailored for investors, analysts, and consultants seeking reliable DCF outcomes.
- User-Centric Design: Clear layout and straightforward instructions catering to all experience levels.
Key Features
- Comprehensive DCF Calculator: Features in-depth unlevered and levered DCF valuation frameworks.
- WACC Calculator: Ready-to-use Weighted Average Cost of Capital spreadsheet with adjustable parameters.
- Customizable Forecast Assumptions: Alter growth projections, capital expenditures, and discount rates as needed.
- Integrated Financial Ratios: Evaluate profitability, leverage, and efficiency ratios for Santander UK plc (SANBL).
- Visual Dashboard and Charts: Graphical representations highlight key valuation metrics for straightforward analysis.
How It Functions
- Step 1: Download the ready-to-use Excel template featuring Santander UK plc’s (SANBL) data.
- Step 2: Review the pre-filled worksheets to familiarize yourself with the essential metrics.
- Step 3: Modify the forecasts and assumptions in the editable yellow cells (WACC, growth rates, profit margins).
- Step 4: Instantly see the updated calculations, including the intrinsic value of Santander UK plc (SANBL).
- Step 5: Utilize the results to make well-informed investment choices or create comprehensive reports.
Why Opt for This Calculator?
- Reliable Data: Access authentic Santander UK plc (SANBL) financials for trustworthy valuation outcomes.
- Customizable Features: Tailor key parameters such as growth rates, WACC, and tax rates to align with your forecasts.
- Efficient: Built-in calculations save you the hassle of starting from the ground up.
- Professional-Quality Tool: Crafted for investors, analysts, and consultants alike.
- User-Friendly Interface: The intuitive design and clear step-by-step guidance make it accessible for all users.
Who Can Benefit from This Product?
- Investors: Precisely evaluate the fair value of Santander UK plc (SANBL) prior to making investment choices.
- CFOs: Utilize a high-quality DCF model for comprehensive financial reporting and analysis.
- Consultants: Swiftly customize the template for client valuation reports.
- Entrepreneurs: Acquire insights into the financial modeling practices of major corporations.
- Educators: Implement it as a resource for teaching valuation techniques.
Contents of the Template
- Comprehensive DCF Model: An editable template featuring detailed valuation calculations.
- Real-World Data: Historical and projected financials of Santander UK plc (SANBL) are preloaded for your analysis.
- Customizable Parameters: Modify WACC, growth rates, and tax assumptions to explore various scenarios.
- Financial Statements: Complete annual and quarterly breakdowns for in-depth analysis.
- Key Ratios: Integrated analysis for assessing profitability, efficiency, and leverage.
- Dashboard with Visual Outputs: Charts and tables that present clear, actionable insights.
Disclaimer
All information, articles, and product details provided on this website are for general informational and educational purposes only. We do not claim any ownership over, nor do we intend to infringe upon, any trademarks, copyrights, logos, brand names, or other intellectual property mentioned or depicted on this site. Such intellectual property remains the property of its respective owners, and any references here are made solely for identification or informational purposes, without implying any affiliation, endorsement, or partnership.
We make no representations or warranties, express or implied, regarding the accuracy, completeness, or suitability of any content or products presented. Nothing on this website should be construed as legal, tax, investment, financial, medical, or other professional advice. In addition, no part of this site—including articles or product references—constitutes a solicitation, recommendation, endorsement, advertisement, or offer to buy or sell any securities, franchises, or other financial instruments, particularly in jurisdictions where such activity would be unlawful.
All content is of a general nature and may not address the specific circumstances of any individual or entity. It is not a substitute for professional advice or services. Any actions you take based on the information provided here are strictly at your own risk. You accept full responsibility for any decisions or outcomes arising from your use of this website and agree to release us from any liability in connection with your use of, or reliance upon, the content or products found herein.