
|
SB Financial Group, Inc. (SBFG): Análisis de 5 Fuerzas [Actualizado en Ene-2025] |
Completamente Editable: Adáptelo A Sus Necesidades En Excel O Sheets
Diseño Profesional: Plantillas Confiables Y Estándares De La Industria
Predeterminadas Para Un Uso Rápido Y Eficiente
Compatible con MAC / PC, completamente desbloqueado
No Se Necesita Experiencia; Fáciles De Seguir
SB Financial Group, Inc. (SBFG) Bundle
En el panorama dinámico de la banca regional, SB Financial Group, Inc. navega por un complejo ecosistema de fuerzas competitivas que dan forma a su posicionamiento estratégico. A medida que las tecnologías financieras evolucionan y la dinámica del mercado cambia, la comprensión de la intrincada interacción del poder de los proveedores, las preferencias de los clientes, las presiones competitivas, los sustitutos tecnológicos y los posibles nuevos participantes del mercado se vuelven cruciales para el crecimiento sostenible y la ventaja competitiva en el sector de servicios financieros del noroeste de Ohio.
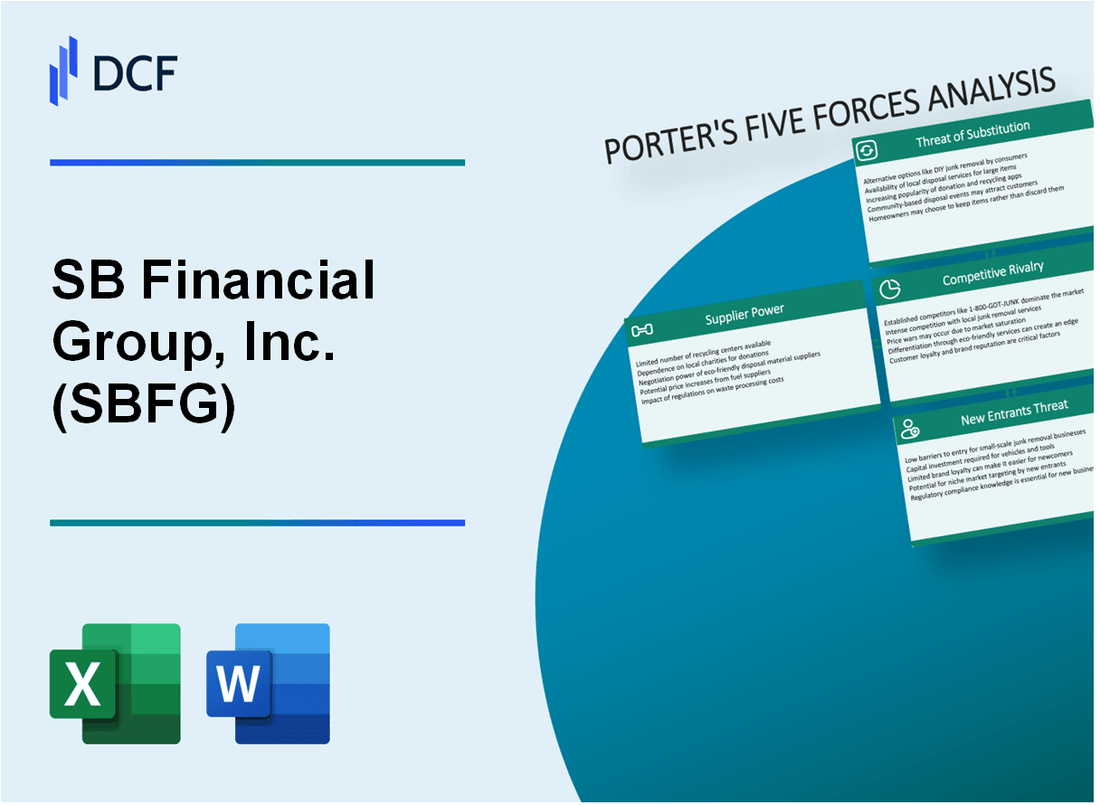
SB Financial Group, Inc. (SBFG) - Las cinco fuerzas de Porter: poder de negociación de los proveedores
Número limitado de proveedores de tecnología bancaria central
A partir de 2024, el mercado central de tecnología bancaria se concentra con aproximadamente 3-4 proveedores principales que dominan la industria. Fiserv, Jack Henry & Asociados y el control de FIS aproximadamente el 80% del mercado de software bancario central para bancos comunitarios.
| Proveedor | Cuota de mercado | Ingresos anuales |
|---|---|---|
| Fiserv | 35% | $ 14.2 mil millones |
| Jack Henry | 25% | $ 1.8 mil millones |
| Fis | 20% | $ 12.5 mil millones |
Altos costos de cambio para la infraestructura bancaria central
El cambio de sistemas bancarios centrales generalmente implica:
- Costos de implementación que van desde $ 500,000 a $ 2.5 millones
- Tiempo de conversión de 12-18 meses
- Posible interrupción en las operaciones bancarias
Dependencia de los proveedores de servicios financieros
SB Financial Group se basa en múltiples proveedores especializados para servicios críticos:
| Categoría de servicio | Número de proveedores clave | Valor de contrato promedio |
|---|---|---|
| Procesamiento de pagos | 2-3 | $ 250,000 anualmente |
| Ciberseguridad | 1-2 | $ 350,000 anualmente |
| Soluciones de cumplimiento | 2-3 | $ 175,000 anualmente |
Requisitos de cumplimiento regulatorio
Los costos de los proveedores relacionados con el cumplimiento han aumentado en un 22% desde 2020. Los bancos deben mantener estrictos protocolos de gestión de proveedores ordenados por los organismos regulatorios.
- Gasto promedio de proveedores de cumplimiento anual: $ 475,000
- La supervisión regulatoria requiere evaluaciones detalladas de riesgos de proveedores
- Selección de proveedores limitada por requisitos de cumplimiento complejos
SB Financial Group, Inc. (SBFG) - Las cinco fuerzas de Porter: poder de negociación de los clientes
Análisis de base de clientes diversos
A partir de 2024, SB Financial Group atiende a 28,745 clientes totales en segmentos de banca personal y comercial, con un desglose de la siguiente manera:
| Segmento de clientes | Número de clientes | Porcentaje |
|---|---|---|
| Banca personal | 19,632 | 68.3% |
| Banca comercial | 9,113 | 31.7% |
Sensibilidad al precio del cliente
Métricas de sensibilidad al precio del cliente para servicios financieros en el noroeste de Ohio:
- Sensibilidad a la tarifa de mantenimiento de la cuenta promedio: 62.4%
- Frecuencia de comparación de tasas de interés: 47.8% de los clientes
- Tolerancia a precios de la función de banca digital: $ 5.75 máximo mensual
Demanda bancaria digital
Tasas de adopción de banca digital para SB Financial Group:
| Servicio digital | Porcentaje de usuario | Crecimiento anual |
|---|---|---|
| Banca móvil | 72.3% | 8.6% |
| Pago de factura en línea | 65.1% | 6.2% |
| Solicitudes de préstamos digitales | 41.5% | 12.3% |
Panorama competitivo regional
Instituciones financieras competidoras en la región del noroeste de Ohio:
- Bancos regionales totales: 27
- Distribución de cuota de mercado:
- SB Financial Group Cuota de mercado: 12.4%
- La participación de mercado combinada de los 3 competidores principales: 48.6%
- Tasa promedio de conmutación del cliente: 3.7% anual
SB Financial Group, Inc. (SBFG) - Las cinco fuerzas de Porter: rivalidad competitiva
Competencia bancaria regional en Ohio y los mercados circundantes
A partir de 2024, SB Financial Group enfrenta la competencia de 12 bancos regionales en el noroeste de Ohio. Los 3 mejores competidores en la región incluyen:
| Nombre del banco | Activos totales | Cuota de mercado |
|---|---|---|
| $ 23.4 mil millones | 15.7% | |
| $ 41.6 mil millones | 22.3% | |
| $ 33.8 mil millones | 18.9% |
Competencia bancaria nacional
Los grandes bancos nacionales compiten agresivamente en el mercado de SBFG:
- JPMorgan Chase: $ 3.74 billones en activos totales
- Bank of America: $ 3.05 billones en activos totales
- Wells Fargo: $ 1.90 billones en activos totales
Tasas de interés y competencia de productos bancarios
Panario de tasas de interés competitivas actuales:
| Producto | Tasa de sbfg | Tasa promedio del mercado |
|---|---|---|
| Cuenta de ahorro personal | 3.25% | 3.40% |
| CD de 5 años | 4.50% | 4.75% |
| Tasa hipotecaria (fijada a 30 años) | 6.85% | 6.95% |
Inversión bancaria digital
Métricas de inversión bancaria digital:
- Usuarios de la plataforma de banca digital SBFG: 42,500
- Inversión anual de tecnología de banca digital: $ 2.3 millones
- Descargas de aplicaciones de banca móvil en 2023: 18,750
SB Financial Group, Inc. (SBFG) - Las cinco fuerzas de Porter: amenaza de sustitutos
Rise de plataformas de banca fintech y digital
A partir del cuarto trimestre de 2023, las compañías de FinTech capturaron el 5.2% de los ingresos bancarios totales, con plataformas bancarias digitales que crecen al 14.3% anual. SB Financial Group enfrenta una competencia directa de plataformas digitales como Chime, que reportó 21.6 millones de usuarios activos en 2023.
| Plataforma de banca digital | Usuarios activos (2023) | Cuota de mercado |
|---|---|---|
| Repicar | 21.6 millones | 38.7% |
| Actual | 4.2 millones | 7.5% |
| Revolutivo | 3.5 millones | 6.3% |
Aparición de soluciones de pago móvil
Las plataformas de pago móvil procesaron $ 1.78 billones en transacciones a nivel mundial en 2023, lo que representa un aumento del 22.5% de 2022.
- Apple Pay procesó $ 576 mil millones en transacciones
- Google Pay manejó $ 342 mil millones
- Venmo procesó $ 245 mil millones
Criptomonedas y tecnologías financieras alternativas
La capitalización del mercado de criptomonedas alcanzó los $ 1.7 billones en 2023, con Bitcoin que representa el 42.5% del valor de mercado total.
| Criptomoneda | Caut de mercado (2023) | % del mercado total |
|---|---|---|
| Bitcoin | $ 723 mil millones | 42.5% |
| Ethereum | $ 265 mil millones | 15.6% |
| Otras criptomonedas | $ 712 mil millones | 41.9% |
Plataformas de inversión y préstamo en línea
Las plataformas de préstamos en línea originaron $ 18.6 mil millones en préstamos durante 2023, desafiando los modelos bancarios tradicionales.
- Sofi originó $ 5.2 mil millones en préstamos personales
- LendingClub procesó $ 4.7 mil millones
- Prosper generó $ 3.9 mil millones en volumen de préstamos
SB Financial Group, Inc. (SBFG) - Las cinco fuerzas de Porter: amenaza de nuevos participantes
Altas barreras reguladoras de entrada en el sector bancario
A partir de 2024, la Reserva Federal requiere requisitos de capital mínimos para las nuevas cartas bancarias:
- Relación de capital de nivel 1: mínimo 8%
- Relación de capital total: mínimo 10%
- Relación de apalancamiento: mínimo 5%
Requisitos de capital significativos
Requisitos iniciales de capital para nuevas instituciones financieras:
| Tipo de institución | Se requiere capital mínimo |
|---|---|
| Banco comunitario | $ 10-20 millones |
| Banco regional | $ 50-100 millones |
| Banco nacional | $ 100-250 millones |
Marcos de cumplimiento y gestión de riesgos
Costos de cumplimiento regulatorio para nuevas instituciones financieras:
- Gasto anual de cumplimiento: $ 1.5-3 millones
- Configuración de cumplimiento inicial: $ 500,000- $ 1.2 millones
- Gastos de informes regulatorios continuos: $ 250,000- $ 750,000 anualmente
Requisitos de infraestructura tecnológica
Inversión tecnológica para la entrada del mercado:
| Componente tecnológico | Costo estimado |
|---|---|
| Sistema bancario central | $ 500,000- $ 2 millones |
| Infraestructura de ciberseguridad | $250,000-$750,000 |
| Plataforma de banca digital | $ 300,000- $ 1 millón |
SB Financial Group, Inc. (SBFG) - Porter's Five Forces: Competitive rivalry
You're looking at the competitive landscape for SB Financial Group, Inc. (SBFG) in its core markets, and honestly, the rivalry is intense. You're dealing with a crowded field across Ohio and Indiana.
The core of SB Financial Group, Inc.'s operations, through The State Bank and Trust Company, is concentrated in ten Ohio counties and two in Northeast, Indiana, operating a total of 26 offices and 26 ATMs as of mid-2025. This geographic focus means direct, head-to-head competition with both massive national banks that have deep pockets and a host of smaller, highly localized community banks that know their turf intimately.
When you stack SB Financial Group, Inc. up against the giants, its scale is definitely a factor in the rivalry. The company reported total assets of $1.49 billion as of Q2 2025. [cite: User provided data] To put that in perspective within the broader financial services arena, that positions SB Financial Group, Inc. as a relatively smaller player, meaning it has to fight harder for every basis point of market share against institutions with asset bases measured in the tens or hundreds of billions.
This pressure from rivals is a clear driver for strategic action, like the acquisition of Marblehead Bancorp, Inc. That deal, which closed on January 17, 2025, was valued in aggregate at approximately $5.0 million, paying shareholders $196.31 in cash per share. The stated goal of such moves is to gain scale and solidify market share, especially in Northwest Ohio, where The Marblehead Bank had a strong local foothold. The integration of Marblehead contributed to a deposit increase of nearly $103 million, or 9%, year-over-year in Q3 2025.
Still, SB Financial Group, Inc. attempts to blunt some of this direct product-line rivalry through diversification. They aren't just a pure-play community bank; they offer banking, mortgage banking, wealth management, private client services, and title insurance through SBFG Title, LLC dba Peak Title. This multi-service approach helps capture more of the customer's wallet and provides revenue streams that don't move in lockstep with core lending.
Here's a quick look at the financial context surrounding this competitive environment as of the mid-year reports:
| Metric | Value (Q2 2025 or H1 2025) | Context |
|---|---|---|
| Total Assets | $1.49 billion | As of Q2 2025. [cite: User provided data] |
| GAAP Net Income | $3.9 million | For Q2 2025. |
| Net Interest Income (6 Months) | $23.4 million | For the six months ending June 30, 2025. |
| Mortgage Banking Revenue (6 Months) | $3.6 million | For the first half of 2025. |
| Marblehead Acquisition Value | $5.0 million | Total transaction value. |
The diversification strategy shows up in the numbers, too. For instance, mortgage banking revenue for the first half of 2025 totaled $3.6 million, a 6.9% increase compared to the first half of 2024. This revenue stream, while smaller than the net interest income of $23.4 million for the same six months, provides a necessary buffer when direct deposit or loan competition heats up.
The competitive intensity forces actions that impact the balance sheet, like the focus on scale. The Q3 2025 results showed loan growth of approximately $80.6 million, or 7.8%, year-over-year, which is a direct response to needing to grow assets in a competitive lending environment. You see this push for scale everywhere, from the acquisition itself to the consistent loan growth reported for six consecutive quarters leading into late 2025.
The rivalry also manifests in shareholder actions. For example, the short interest ratio, or days to cover, stood at 8.08, with short interest increasing by 42.78% in the most recent measurement period, suggesting some market skepticism about navigating this competitive pressure.
You can see the competitive pressures reflected in the operational metrics:
- Loan growth was $89.3 million year-over-year in Q2 2025.
- Deposit growth was $134.6 million year-over-year in Q2 2025.
- The Marblehead acquisition added $51 million to deposits in Q3 2025.
- Mortgage originations declined to $67.6 million in Q3 2025.
- The Price to Earnings Ratio was 11.75, cheaper than the market average of about 43.29.
Finance: draft a sensitivity analysis on deposit retention post-Marblehead integration by next Tuesday.
SB Financial Group, Inc. (SBFG) - Porter's Five Forces: Threat of substitutes
The threat of substitutes for SB Financial Group, Inc. (SBFG) is substantial, stemming from non-bank entities that offer similar financial products with potentially lower operational friction or cost structures. You need to keep a close watch on these alternatives as they directly compete for your core business lines.
Competition in Mortgage Originations
There is a significant threat from non-bank mortgage lenders. SB Financial Group, Inc. has a stated goal to originate $400 million in mortgages for fiscal year 2025. However, the broader market shows non-bank dominance. In the first quarter of 2025, the nonbank share of total originations rose to 66.4%, up from 65.2% in 2024. Furthermore, non-bank financial institutions accounted for 17 of the top 25 U.S. mortgage lenders based on 2024 origination data. The total single-family mortgage origination volume for 2025 is projected to be around $2.0 trillion nationally, meaning non-banks control a massive portion of the market where SBFG is aiming for its $400 million target.
Substitutes in Payments, Lending, and Wealth Management
Fintech firms present a structural threat across several SB Financial Group, Inc. services. These technology-driven companies often operate with lower overhead costs compared to traditional community banks. While I don't have the exact overhead comparison figures for late 2025, the industry trend suggests their lower cost base allows for more aggressive pricing or faster service delivery in payments and lending. For wealth management, national brokerage firms serve as a direct substitute for SB Financial Group, Inc.'s wealth management and private client services. These large firms manage assets for millions of clients, offering scale and extensive product shelves that can be hard for a regional player to match.
Here's a quick comparison of the competitive landscape for deposit-like products, where high rates make substitutes more attractive:
| Substitute Product/Fund Type | Data Point | Date/Period |
|---|---|---|
| SB Financial Group, Inc. Total Deposits | $1.26 billion | Q3 2025 |
| Vanguard Federal Money Market Fund (VMFXX) 7-Day SEC Yield | 3.87% | November 24, 2025 |
| Fidelity Money Market Fund (SPRXX) 7-Day Yield | 3.82% | October 31, 2025 |
| U.S. Treasury Bills, Notes, and Bond Rates (Yield to Maturity) | Varies (Rates fluctuate) | As of November 26, 2025 |
The Impact of a High-Rate Environment on Deposits
In a high-rate environment, money market funds and government securities become a particularly strong substitute for traditional bank deposits, which is a key funding source for SB Financial Group, Inc. (total deposits were $1.26 billion as of September 30, 2025). When you can earn a near 4.00% yield on a highly liquid money market fund-for example, the Vanguard Federal Money Market Fund yielding 3.87% as of late November 2025-the incentive for depositors to keep non-interest-bearing or low-interest-bearing balances at a community bank lessens. You are definitely competing against the market rates for risk-free alternatives.
Wealth Management Competition
National brokerage firms substitute for SB Financial Group, Inc.'s wealth management and private client services by offering broad platforms. These firms often have significant brand recognition and the ability to cross-sell a wider array of investment products, which can pull high-net-worth clients away from a community bank's private client division. The threat is amplified by the fact that many of these national players have lower relative operating costs per dollar of assets managed due to their sheer scale.
Key competitive pressures from substitutes include:
- - Significant threat from non-bank mortgage lenders competing with SBFG's projected $400 million in 2025 mortgage originations.
- - Fintech firms offer substitute services for payments, lending, and wealth management with lower overhead costs.
- - Money market funds and government securities are a strong substitute for traditional bank deposits in a high-rate environment, with yields near 3.90% available in late November 2025.
- - National brokerage firms substitute for SBFG's wealth management and private client services.
SB Financial Group, Inc. (SBFG) - Porter's Five Forces: Threat of new entrants
You're looking at the barriers to entry for a new bank trying to compete with SB Financial Group, Inc. in their Ohio and Indiana footprint. Honestly, the hurdles are significant, especially for traditional brick-and-mortar competitors.
Regulatory barriers are high, requiring significant capital and compliance infrastructure, which defintely deters new banks. While there's a push to ease requirements for smaller players, the baseline is steep. For instance, there is a proposal to lower the Community Bank Leverage Ratio (CBLR) for banks under $10 billion in assets from 9% to 8%. Still, even with potential relief, the initial capital outlay to meet all federal standards remains a major deterrent for a startup.
Need for a physical branch network (26 offices) in their regional footprint creates a high cost of entry. SB Financial Group, Inc. operates 26 offices across Ohio and Indiana as of its Q3 2025 reporting. Establishing that level of physical presence, complete with ATMs and local staff, demands massive upfront investment in real estate and personnel that a new entrant must match to offer comparable convenience.
Entrants must overcome customer inertia and the trust built by SB Financial Group, Inc. over its long operating history. The State Bank and Trust Company, the primary subsidiary, has roots stretching back decades, with the holding company itself tracing its history to 1983. That level of tenure builds deep, sticky relationships in community banking that take years, if not decades, to erode.
Digital-only banks (neobanks) pose a low-cost threat, but lack SB Financial Group, Inc.'s local commercial lending expertise. While fintechs are showing increased interest in the regulated space-with 20 charter filings submitted through October 3rd, 2025, an all-time high-these digital players often struggle to replicate the deep, relationship-based commercial and agricultural lending that is central to SB Financial Group, Inc.'s business model.
Here's the quick math on how the entry landscape looks compared to SB Financial Group, Inc.'s established position:
| Metric | SB Financial Group, Inc. (SBFG) Context | New Entrant Market Data (Late 2025) |
|---|---|---|
| Physical Footprint | 26 offices across Ohio and Indiana | High cost to replicate physical service points. |
| Operating History | Holding company founded in 1983 | Lack of established trust and local market tenure. |
| Recent De Novo Formation | N/A (Incumbent) | Only six new banks chartered in 2024. |
| Charter Application Activity | N/A (Incumbent) | 20 charter filings submitted through October 2025. |
| Total US Banks | N/A (Incumbent) | Total FDIC-insured institutions fell to 4,487 as of December 2024. |
The regulatory environment itself shows the high barrier, even as it tries to adapt. For example, the aggregate Tier 1 capital requirements for large holding companies are estimated to reduce by less than 2% under the new rules taking effect in 2026.
You can see the pressure points for new entrants:
- Regulatory hurdles demand significant upfront capital.
- Physical infrastructure costs are substantial.
- Local commercial lending relationships are hard to win.
- Digital entrants lack deep local expertise.
What this estimate hides is the time it takes for a new bank to build a deposit base large enough to fund meaningful commercial loans. If onboarding takes 14+ days, churn risk rises.
Finance: draft 2026 capital expenditure budget for branch modernization by Friday.
Disclaimer
All information, articles, and product details provided on this website are for general informational and educational purposes only. We do not claim any ownership over, nor do we intend to infringe upon, any trademarks, copyrights, logos, brand names, or other intellectual property mentioned or depicted on this site. Such intellectual property remains the property of its respective owners, and any references here are made solely for identification or informational purposes, without implying any affiliation, endorsement, or partnership.
We make no representations or warranties, express or implied, regarding the accuracy, completeness, or suitability of any content or products presented. Nothing on this website should be construed as legal, tax, investment, financial, medical, or other professional advice. In addition, no part of this site—including articles or product references—constitutes a solicitation, recommendation, endorsement, advertisement, or offer to buy or sell any securities, franchises, or other financial instruments, particularly in jurisdictions where such activity would be unlawful.
All content is of a general nature and may not address the specific circumstances of any individual or entity. It is not a substitute for professional advice or services. Any actions you take based on the information provided here are strictly at your own risk. You accept full responsibility for any decisions or outcomes arising from your use of this website and agree to release us from any liability in connection with your use of, or reliance upon, the content or products found herein.