
|
SBM Offshore N.V. (SBMO.As) Valoración de DCF |
Completamente Editable: Adáptelo A Sus Necesidades En Excel O Sheets
Diseño Profesional: Plantillas Confiables Y Estándares De La Industria
Predeterminadas Para Un Uso Rápido Y Eficiente
Compatible con MAC / PC, completamente desbloqueado
No Se Necesita Experiencia; Fáciles De Seguir
SBM Offshore N.V. (SBMO.AS) Bundle
¿Busca evaluar el valor intrínseco de SBM Offshore N.V.? Nuestra calculadora SBMOAS DCF integra datos del mundo real con extensas características de personalización, lo que le permite refinar sus pronósticos y mejorar sus estrategias de inversión.
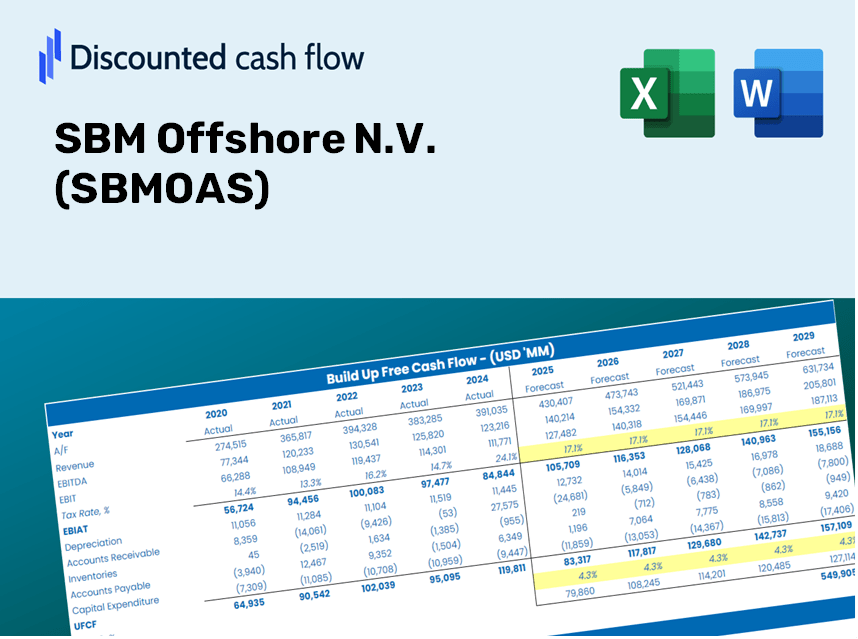
Discounted Cash Flow (DCF) - (USD MM)
| Year | AY1 2020 |
AY2 2021 |
AY3 2022 |
AY4 2023 |
AY5 2024 |
FY1 2025 |
FY2 2026 |
FY3 2027 |
FY4 2028 |
FY5 2029 |
|---|---|---|---|---|---|---|---|---|---|---|
| Revenue | 3,015.2 | 3,232.5 | 4,237.3 | 4,279.6 | 4,126.1 | 4,494.3 | 4,895.5 | 5,332.4 | 5,808.3 | 6,326.8 |
| Revenue Growth, % | 0 | 7.21 | 31.08 | 0.99735 | -3.59 | 8.93 | 8.93 | 8.93 | 8.93 | 8.93 |
| EBITDA | 818.5 | 827.1 | 972.9 | 1,199.7 | 1,035.0 | 1,157.8 | 1,261.2 | 1,373.7 | 1,496.3 | 1,629.9 |
| EBITDA, % | 27.15 | 25.59 | 22.96 | 28.03 | 25.08 | 25.76 | 25.76 | 25.76 | 25.76 | 25.76 |
| Depreciation | 276.0 | 96.6 | 73.3 | 56.1 | 60.4 | 149.6 | 163.0 | 177.5 | 193.4 | 210.6 |
| Depreciation, % | 9.15 | 2.99 | 1.73 | 1.31 | 1.46 | 3.33 | 3.33 | 3.33 | 3.33 | 3.33 |
| EBIT | 542.5 | 730.5 | 899.6 | 1,143.6 | 974.6 | 1,008.2 | 1,098.2 | 1,196.2 | 1,303.0 | 1,419.3 |
| EBIT, % | 17.99 | 22.6 | 21.23 | 26.72 | 23.62 | 22.43 | 22.43 | 22.43 | 22.43 | 22.43 |
| Total Cash | 357.1 | 879.7 | 588.2 | 468.3 | 695.2 | 725.6 | 790.4 | 861.0 | 937.8 | 1,021.5 |
| Total Cash, percent | .0 | .0 | .0 | .0 | .0 | .0 | .0 | .0 | .0 | .0 |
| Account Receivables | 2,346.8 | 4,224.4 | 6,654.0 | 6,843.7 | 6,754.9 | 4,295.1 | 4,678.4 | 5,096.0 | 5,550.8 | 6,046.3 |
| Account Receivables, % | 77.83 | 130.68 | 157.03 | 159.92 | 163.71 | 95.57 | 95.57 | 95.57 | 95.57 | 95.57 |
| Inventories | 123.3 | 12.1 | 22.4 | 127.6 | 31.9 | 78.6 | 85.7 | 93.3 | 101.6 | 110.7 |
| Inventories, % | 4.09 | 0.37353 | 0.52921 | 2.98 | 0.77341 | 1.75 | 1.75 | 1.75 | 1.75 | 1.75 |
| Accounts Payable | 113.0 | 130.2 | 175.9 | 219.1 | 204.4 | 197.8 | 215.4 | 234.6 | 255.6 | 278.4 |
| Accounts Payable, % | 3.75 | 4.03 | 4.15 | 5.12 | 4.95 | 4.4 | 4.4 | 4.4 | 4.4 | 4.4 |
| Capital Expenditure | -60.4 | -52.6 | -70.7 | -149.2 | -100.0 | -100.8 | -109.8 | -119.6 | -130.2 | -141.8 |
| Capital Expenditure, % | -2 | -1.63 | -1.67 | -3.49 | -2.42 | -2.24 | -2.24 | -2.24 | -2.24 | -2.24 |
| Tax Rate, % | 47 | 47 | 47 | 47 | 47 | 47 | 47 | 47 | 47 | 47 |
| EBITAT | 283.1 | 538.1 | 613.3 | 953.4 | 516.6 | 666.2 | 725.7 | 790.4 | 861.0 | 937.8 |
| Depreciation | ||||||||||
| Changes in Account Receivables | ||||||||||
| Changes in Inventories | ||||||||||
| Changes in Accounts Payable | ||||||||||
| Capital Expenditure | ||||||||||
| UFCF | -1,858.4 | -1,167.0 | -1,778.3 | 608.4 | 646.8 | 3,121.5 | 406.2 | 442.4 | 481.9 | 524.9 |
| WACC, % | 5.73 | 7.02 | 6.69 | 7.6 | 5.78 | 6.57 | 6.57 | 6.57 | 6.57 | 6.57 |
| PV UFCF | ||||||||||
| SUM PV UFCF | 4,408.1 | |||||||||
| Long Term Growth Rate, % | 0.50 | |||||||||
| Free cash flow (T + 1) | 528 | |||||||||
| Terminal Value | 8,698 | |||||||||
| Present Terminal Value | 6,329 | |||||||||
| Enterprise Value | 10,737 | |||||||||
| Net Debt | 7,018 | |||||||||
| Equity Value | 3,719 | |||||||||
| Diluted Shares Outstanding, MM | 181 | |||||||||
| Equity Value Per Share | 20.54 |
What You Will Receive
- Flexible Forecast Inputs: Easily modify key assumptions (growth %, margins, WACC) to explore various scenarios.
- Real-Time Data: SBM Offshore N.V.’s financial information pre-loaded to kickstart your analysis.
- Automatic DCF Calculations: The template computes Net Present Value (NPV) and intrinsic value automatically.
- Customizable and Professional Design: A sleek Excel model designed to meet your valuation requirements.
- Engineered for Analysts and Investors: Perfect for evaluating projections, validating strategies, and saving valuable time.
Key Features
- Comprehensive DCF Calculator: Offers detailed unlevered and levered DCF valuation frameworks tailored for SBM Offshore N.V. (SBMOAS).
- WACC Calculator: Features a ready-to-use Weighted Average Cost of Capital sheet with adjustable parameters.
- Customizable Forecast Assumptions: Easily alter growth rates, capital expenditures, and discount rates based on specific analyses.
- Integrated Financial Ratios: Evaluate profitability, leverage, and efficiency ratios relevant to SBM Offshore N.V. (SBMOAS).
- Dynamic Dashboard and Charts: Visual representations consolidate essential valuation metrics for straightforward analysis.
How It Functions
- Download the Template: Gain immediate access to the Excel-based SBM Offshore DCF Calculator.
- Input Your Assumptions: Modify the yellow-highlighted cells for growth rates, WACC, margins, and additional parameters.
- Instant Calculations: The model automatically recalculates SBM Offshore's intrinsic value.
- Test Scenarios: Experiment with different assumptions to assess potential changes in valuation.
- Analyze and Decide: Utilize the results to inform your investment strategy or financial analysis.
Why Choose SBM Offshore N.V. (SBMOAS)?
- Time Efficiency: Eliminate the hassle of building a financial model from the ground up – our tools are ready for immediate use.
- Enhanced Accuracy: Our dependable financial metrics and formulas minimize valuation errors.
- Completely Customizable: Adjust the model to align with your specific assumptions and forecasts.
- Easy to Understand: Intuitive charts and outputs simplify the analysis of results.
- Endorsed by Professionals: Crafted for experts who prioritize accuracy and functionality.
Who Can Benefit from This Product?
- Institutional Investors: Develop comprehensive and accurate valuation models for portfolio evaluation.
- Corporate Finance Departments: Assess valuation scenarios to inform strategic decision-making.
- Consultants and Financial Advisors: Deliver precise valuation insights for SBM Offshore N.V. (SBMOAS) to clients.
- Students and Instructors: Utilize real-life data to practice and teach financial modeling techniques.
- Industry Enthusiasts: Gain insights into how marine and offshore companies like SBM Offshore N.V. (SBMOAS) are valued in the marketplace.
Contents of the Template
- Pre-Filled Data: Contains SBM Offshore N.V.'s historical financials and projections.
- Discounted Cash Flow Model: An editable DCF valuation model with automated calculations.
- Weighted Average Cost of Capital (WACC): A specific sheet for WACC calculations based on user-defined inputs.
- Key Financial Ratios: Evaluate SBM Offshore N.V.'s profitability, efficiency, and leverage metrics.
- Customizable Inputs: Easy adjustments for revenue growth, profit margins, and tax rates.
- Clear Dashboard: Visual representations and tables summarizing essential valuation outcomes.
Disclaimer
All information, articles, and product details provided on this website are for general informational and educational purposes only. We do not claim any ownership over, nor do we intend to infringe upon, any trademarks, copyrights, logos, brand names, or other intellectual property mentioned or depicted on this site. Such intellectual property remains the property of its respective owners, and any references here are made solely for identification or informational purposes, without implying any affiliation, endorsement, or partnership.
We make no representations or warranties, express or implied, regarding the accuracy, completeness, or suitability of any content or products presented. Nothing on this website should be construed as legal, tax, investment, financial, medical, or other professional advice. In addition, no part of this site—including articles or product references—constitutes a solicitation, recommendation, endorsement, advertisement, or offer to buy or sell any securities, franchises, or other financial instruments, particularly in jurisdictions where such activity would be unlawful.
All content is of a general nature and may not address the specific circumstances of any individual or entity. It is not a substitute for professional advice or services. Any actions you take based on the information provided here are strictly at your own risk. You accept full responsibility for any decisions or outcomes arising from your use of this website and agree to release us from any liability in connection with your use of, or reliance upon, the content or products found herein.