
|
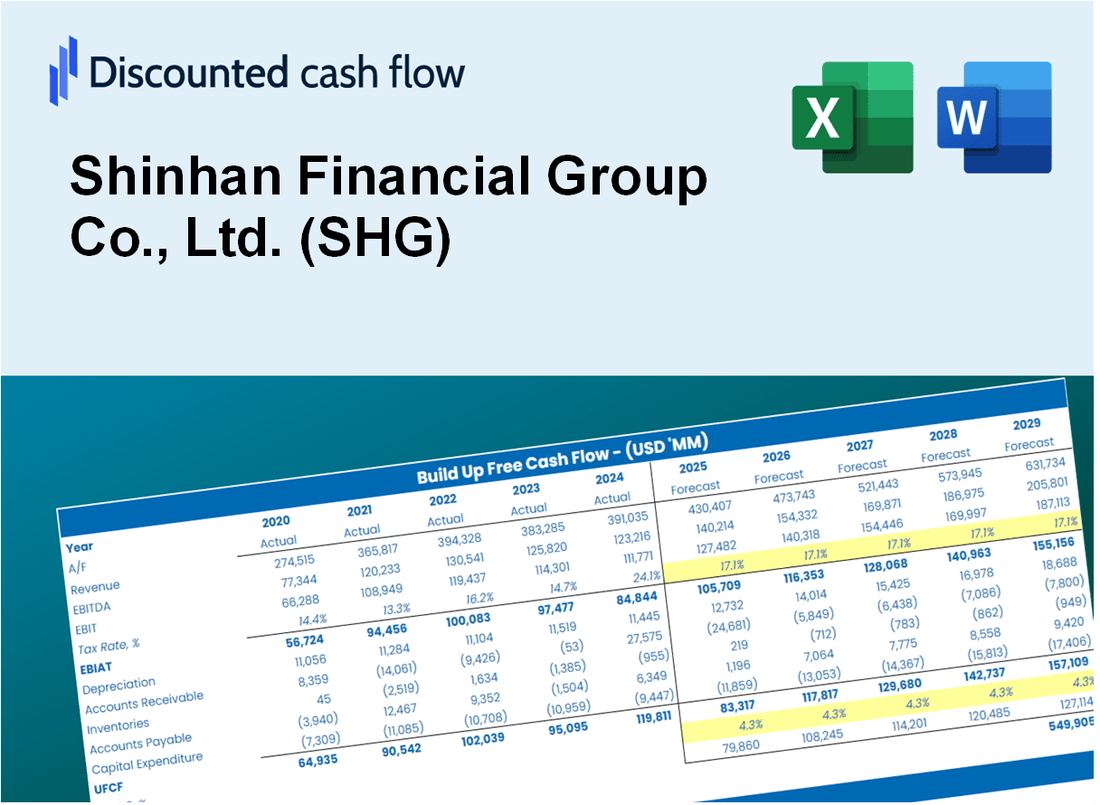
Valoración DCF del Grupo Financiero Shinhan S.A. (SHG) |
Completamente Editable: Adáptelo A Sus Necesidades En Excel O Sheets
Diseño Profesional: Plantillas Confiables Y Estándares De La Industria
Predeterminadas Para Un Uso Rápido Y Eficiente
Compatible con MAC / PC, completamente desbloqueado
No Se Necesita Experiencia; Fáciles De Seguir
Shinhan Financial Group Co., Ltd. (SHG) Bundle
¡Explore el potencial financiero de Shinhan Financial Group Co., Ltd. (SHG) con nuestra calculadora DCF fácil de usar! Ingrese sus proyecciones para el crecimiento, los márgenes y los gastos para calcular el valor intrínseco de Shinhan Financial Group Co., Ltd. (SHG) y mejorar su estrategia de inversión.
Discounted Cash Flow (DCF) - (USD MM)
| Year | AY1 2020 |
AY2 2021 |
AY3 2022 |
AY4 2023 |
AY5 2024 |
FY1 2025 |
FY2 2026 |
FY3 2027 |
FY4 2028 |
FY5 2029 |
|---|---|---|---|---|---|---|---|---|---|---|
| Revenue | 17,745.8 | 17,767.5 | 16,946.4 | 23,319.4 | 24,405.3 | 26,709.5 | 29,231.1 | 31,990.9 | 35,011.2 | 38,316.7 |
| Revenue Growth, % | 0 | 0.12238 | -4.62 | 37.61 | 4.66 | 9.44 | 9.44 | 9.44 | 9.44 | 9.44 |
| EBITDA | 3,809.8 | 4,474.9 | 5,082.0 | 4,932.7 | 5,042.8 | 6,327.9 | 6,925.4 | 7,579.2 | 8,294.8 | 9,077.9 |
| EBITDA, % | 21.47 | 25.19 | 29.99 | 21.15 | 20.66 | 23.69 | 23.69 | 23.69 | 23.69 | 23.69 |
| Depreciation | 530.2 | 622.8 | 689.7 | 817.5 | 883.3 | 944.9 | 1,034.1 | 1,131.7 | 1,238.5 | 1,355.5 |
| Depreciation, % | 2.99 | 3.51 | 4.07 | 3.51 | 3.62 | 3.54 | 3.54 | 3.54 | 3.54 | 3.54 |
| EBIT | 3,279.7 | 3,852.1 | 4,392.3 | 4,115.2 | 4,159.4 | 5,383.1 | 5,891.3 | 6,447.5 | 7,056.2 | 7,722.4 |
| EBIT, % | 18.48 | 21.68 | 25.92 | 17.65 | 17.04 | 20.15 | 20.15 | 20.15 | 20.15 | 20.15 |
| Total Cash | 64,071.6 | 82,747.8 | 80,397.9 | 86,980.2 | 93,465.1 | 26,709.5 | 29,231.1 | 31,990.9 | 35,011.2 | 38,316.7 |
| Total Cash, percent | .0 | .0 | .0 | .0 | .0 | .0 | .0 | .0 | .0 | .0 |
| Account Receivables | 10,417.1 | 10.5 | 10,213.9 | 14,479.1 | 12,056.8 | 12,314.4 | 13,477.0 | 14,749.4 | 16,141.9 | 17,665.9 |
| Account Receivables, % | 58.7 | 0.05886076 | 60.27 | 62.09 | 49.4 | 46.1 | 46.1 | 46.1 | 46.1 | 46.1 |
| Inventories | .0 | .0 | .0 | .0 | .0 | .0 | .0 | .0 | .0 | .0 |
| Inventories, % | 0 | 0 | 0 | 0 | 0 | 0 | 0 | 0 | 0 | 0 |
| Accounts Payable | 10,051.0 | 9,687.3 | 8,516.0 | 13,050.9 | 10,445.6 | 13,898.5 | 15,210.7 | 16,646.8 | 18,218.4 | 19,938.5 |
| Accounts Payable, % | 56.64 | 54.52 | 50.25 | 55.97 | 42.8 | 52.04 | 52.04 | 52.04 | 52.04 | 52.04 |
| Capital Expenditure | -443.0 | -614.2 | -650.7 | -494.1 | -537.3 | -753.9 | -825.1 | -903.0 | -988.2 | -1,081.5 |
| Capital Expenditure, % | -2.5 | -3.46 | -3.84 | -2.12 | -2.2 | -2.82 | -2.82 | -2.82 | -2.82 | -2.82 |
| Tax Rate, % | 26.19 | 26.19 | 26.19 | 26.19 | 26.19 | 26.19 | 26.19 | 26.19 | 26.19 | 26.19 |
| EBITAT | 2,355.7 | 2,772.9 | 3,218.8 | 3,013.5 | 3,070.1 | 3,920.3 | 4,290.4 | 4,695.5 | 5,138.8 | 5,624.0 |
| Depreciation | ||||||||||
| Changes in Account Receivables | ||||||||||
| Changes in Inventories | ||||||||||
| Changes in Accounts Payable | ||||||||||
| Capital Expenditure | ||||||||||
| UFCF | 2,076.8 | 12,824.4 | -8,116.9 | 3,606.6 | 3,233.2 | 7,306.6 | 4,649.0 | 5,087.9 | 5,568.3 | 6,094.0 |
| WACC, % | 8.11 | 8.12 | 8.24 | 8.24 | 8.29 | 8.2 | 8.2 | 8.2 | 8.2 | 8.2 |
| PV UFCF | ||||||||||
| SUM PV UFCF | 22,912.5 | |||||||||
| Long Term Growth Rate, % | 2.00 | |||||||||
| Free cash flow (T + 1) | 6,216 | |||||||||
| Terminal Value | 100,258 | |||||||||
| Present Terminal Value | 67,606 | |||||||||
| Enterprise Value | 90,518 | |||||||||
| Net Debt | 74,914 | |||||||||
| Equity Value | 15,604 | |||||||||
| Diluted Shares Outstanding, MM | 506 | |||||||||
| Equity Value Per Share | 30.82 |
What You Will Get
- Real SHG Financial Data: Pre-filled with Shinhan Financial Group’s historical and projected data for precise analysis.
- Fully Editable Template: Modify key inputs like revenue growth, WACC, and EBITDA % with ease.
- Automatic Calculations: See Shinhan Financial Group’s intrinsic value update instantly based on your changes.
- Professional Valuation Tool: Designed for investors, analysts, and consultants seeking accurate DCF results.
- User-Friendly Design: Simple structure and clear instructions for all experience levels.
Key Features
- 🔍 Real-Life SHG Financials: Pre-filled historical and projected data for Shinhan Financial Group Co., Ltd. (SHG).
- ✏️ Fully Customizable Inputs: Adjust all critical parameters (yellow cells) like WACC, growth %, and tax rates.
- 📊 Professional DCF Valuation: Built-in formulas calculate Shinhan Financial Group’s intrinsic value using the Discounted Cash Flow method.
- ⚡ Instant Results: Visualize Shinhan Financial Group’s valuation instantly after making changes.
- Scenario Analysis: Test and compare outcomes for various financial assumptions side-by-side.
How It Works
- 1. Access the Template: Download and open the Excel file containing Shinhan Financial Group Co., Ltd.'s (SHG) preloaded financial data.
- 2. Modify Assumptions: Adjust key inputs such as growth rates, WACC, and capital expenditures tailored to (SHG).
- 3. Analyze Results Instantly: The DCF model automatically computes intrinsic value and NPV for (SHG).
- 4. Explore Scenarios: Evaluate various forecasts to assess different valuation possibilities for (SHG).
- 5. Present with Assurance: Deliver expert valuation insights to bolster your decision-making for (SHG).
Why Choose Shinhan Financial Group (SHG) Calculator?
- Accuracy: Leverages real Shinhan Financial Group data for precise calculations.
- Flexibility: Allows users to easily adjust and experiment with various inputs.
- Time-Saving: Eliminate the need to create a financial model from the ground up.
- Professional-Grade: Crafted with the expertise and precision expected from a top-tier financial institution.
- User-Friendly: Intuitive design suitable for both seasoned professionals and novices.
Who Should Use This Product?
- Investors: Accurately estimate Shinhan Financial Group’s fair value before making investment decisions.
- CFOs: Leverage a professional-grade DCF model for financial reporting and analysis at Shinhan Financial Group (SHG).
- Consultants: Quickly adapt the template for valuation reports tailored to clients in the financial sector.
- Entrepreneurs: Gain insights into financial modeling practices employed by leading financial institutions.
- Educators: Use it as a teaching tool to demonstrate valuation methodologies in finance.
What the Template Contains
- Historical Data: Includes Shinhan Financial Group's past financials and baseline forecasts.
- DCF and Levered DCF Models: Detailed templates to calculate Shinhan Financial Group's intrinsic value.
- WACC Sheet: Pre-built calculations for Weighted Average Cost of Capital.
- Editable Inputs: Modify key drivers like growth rates, EBITDA %, and CAPEX assumptions.
- Quarterly and Annual Statements: A complete breakdown of Shinhan Financial Group's financials.
- Interactive Dashboard: Visualize valuation results and projections dynamically.
Disclaimer
All information, articles, and product details provided on this website are for general informational and educational purposes only. We do not claim any ownership over, nor do we intend to infringe upon, any trademarks, copyrights, logos, brand names, or other intellectual property mentioned or depicted on this site. Such intellectual property remains the property of its respective owners, and any references here are made solely for identification or informational purposes, without implying any affiliation, endorsement, or partnership.
We make no representations or warranties, express or implied, regarding the accuracy, completeness, or suitability of any content or products presented. Nothing on this website should be construed as legal, tax, investment, financial, medical, or other professional advice. In addition, no part of this site—including articles or product references—constitutes a solicitation, recommendation, endorsement, advertisement, or offer to buy or sell any securities, franchises, or other financial instruments, particularly in jurisdictions where such activity would be unlawful.
All content is of a general nature and may not address the specific circumstances of any individual or entity. It is not a substitute for professional advice or services. Any actions you take based on the information provided here are strictly at your own risk. You accept full responsibility for any decisions or outcomes arising from your use of this website and agree to release us from any liability in connection with your use of, or reliance upon, the content or products found herein.