
|
Valoración DCF de Semler Scientific, Inc. (SMLR) |
Completamente Editable: Adáptelo A Sus Necesidades En Excel O Sheets
Diseño Profesional: Plantillas Confiables Y Estándares De La Industria
Predeterminadas Para Un Uso Rápido Y Eficiente
Compatible con MAC / PC, completamente desbloqueado
No Se Necesita Experiencia; Fáciles De Seguir
Semler Scientific, Inc. (SMLR) Bundle
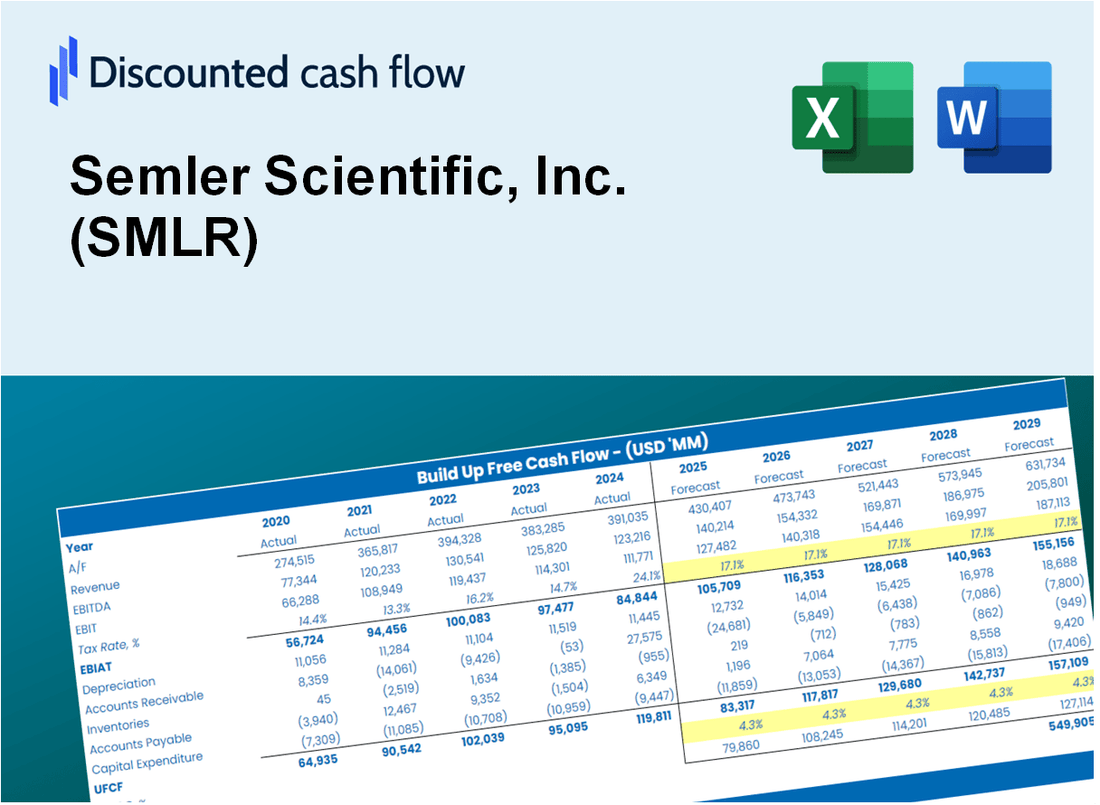
¡Obtenga información sobre su análisis de valoración de Semler Scientific, Inc. (SMLR) utilizando nuestra sofisticada calculadora DCF! Esta plantilla de Excel viene previamente con datos precisos (SMLR), lo que le permite ajustar los pronósticos y supuestos para determinar el valor intrínseco de Semler Scientific, Inc. con precisión.
What You Will Get
- Real Semler Scientific Data: Preloaded financials – from revenue to EBIT – based on actual and projected figures for Semler Scientific, Inc. (SMLR).
- Full Customization: Adjust all critical parameters (yellow cells) like WACC, growth %, and tax rates to fit your analysis of Semler Scientific, Inc. (SMLR).
- Instant Valuation Updates: Automatic recalculations to analyze the impact of changes on Semler Scientific, Inc. (SMLR)'s fair value.
- Versatile Excel Template: Tailored for quick edits, scenario testing, and detailed projections specific to Semler Scientific, Inc. (SMLR).
- Time-Saving and Accurate: Skip building models from scratch while maintaining precision and flexibility for Semler Scientific, Inc. (SMLR).
Key Features
- Comprehensive Financial Model: Offers detailed revenue projections and expense forecasting tailored for Semler Scientific, Inc. (SMLR).
- Customizable Valuation Tools: Includes pre-built models for Discounted Cash Flow (DCF) and Comparable Company Analysis.
- Adjustable Market Assumptions: Easily modify key inputs such as growth rates and market penetration strategies.
- Integrated Performance Metrics: Evaluate key financial ratios including return on equity, debt-to-equity, and gross margin for Semler Scientific, Inc. (SMLR).
- User-Friendly Dashboard: Visual representations of financial data and valuation insights for straightforward decision-making.
How It Works
- Download the Template: Gain immediate access to the Excel-based SMLR DCF Calculator.
- Input Your Assumptions: Modify the yellow-highlighted cells for growth rates, WACC, margins, and other variables.
- Instant Calculations: The model automatically recalculates Semler Scientific’s intrinsic value.
- Test Scenarios: Explore various assumptions to assess potential changes in valuation.
- Analyze and Decide: Utilize the outcomes to inform your investment or financial decisions.
Why Choose Semler Scientific, Inc. (SMLR)?
- Innovative Solutions: Cutting-edge technology tailored for enhancing healthcare delivery.
- Proven Results: Our products are backed by extensive research and clinical validation.
- User-Friendly: Designed with the end-user in mind, ensuring ease of use in various settings.
- Comprehensive Support: Dedicated customer service to assist with implementation and training.
- Industry Expertise: A trusted name in the medical field, committed to advancing patient care.
Who Should Use This Product?
- Investors: Evaluate Semler Scientific’s valuation before making investment decisions.
- CFOs and Financial Analysts: Enhance valuation methodologies and assess financial forecasts.
- Startup Founders: Discover how established companies like Semler Scientific are valued.
- Consultants: Create detailed valuation reports for clients in the healthcare sector.
- Students and Educators: Utilize real-time data to practice and teach valuation strategies.
What the Template Contains
- Operating and Balance Sheet Data: Pre-filled Semler Scientific historical data and forecasts, including revenue, EBITDA, EBIT, and capital expenditures.
- WACC Calculation: A dedicated sheet for Weighted Average Cost of Capital (WACC), including parameters like Beta, risk-free rate, and share price.
- DCF Valuation (Unlevered and Levered): Editable Discounted Cash Flow models showing intrinsic value with detailed calculations.
- Financial Statements: Pre-loaded financial statements (annual and quarterly) to support analysis.
- Key Ratios: Includes profitability, leverage, and efficiency ratios for Semler Scientific, Inc. (SMLR).
- Dashboard and Charts: Visual summary of valuation outputs and assumptions to analyze results easily.
Disclaimer
All information, articles, and product details provided on this website are for general informational and educational purposes only. We do not claim any ownership over, nor do we intend to infringe upon, any trademarks, copyrights, logos, brand names, or other intellectual property mentioned or depicted on this site. Such intellectual property remains the property of its respective owners, and any references here are made solely for identification or informational purposes, without implying any affiliation, endorsement, or partnership.
We make no representations or warranties, express or implied, regarding the accuracy, completeness, or suitability of any content or products presented. Nothing on this website should be construed as legal, tax, investment, financial, medical, or other professional advice. In addition, no part of this site—including articles or product references—constitutes a solicitation, recommendation, endorsement, advertisement, or offer to buy or sell any securities, franchises, or other financial instruments, particularly in jurisdictions where such activity would be unlawful.
All content is of a general nature and may not address the specific circumstances of any individual or entity. It is not a substitute for professional advice or services. Any actions you take based on the information provided here are strictly at your own risk. You accept full responsibility for any decisions or outcomes arising from your use of this website and agree to release us from any liability in connection with your use of, or reliance upon, the content or products found herein.