
|
Valoración DCF de S&P Global Inc. (SPGI) |
Completamente Editable: Adáptelo A Sus Necesidades En Excel O Sheets
Diseño Profesional: Plantillas Confiables Y Estándares De La Industria
Predeterminadas Para Un Uso Rápido Y Eficiente
Compatible con MAC / PC, completamente desbloqueado
No Se Necesita Experiencia; Fáciles De Seguir
S&P Global Inc. (SPGI) Bundle
¡Evalúe la perspectiva financiera de S&P Global Inc. (SPGI) con precisión experta! Esta calculadora DCF (SPGI) ofrece datos financieros preconsados y flexibilidad total para modificar el crecimiento de los ingresos, WACC, los márgenes y otros supuestos esenciales para alinearse con sus proyecciones.
What You Will Get
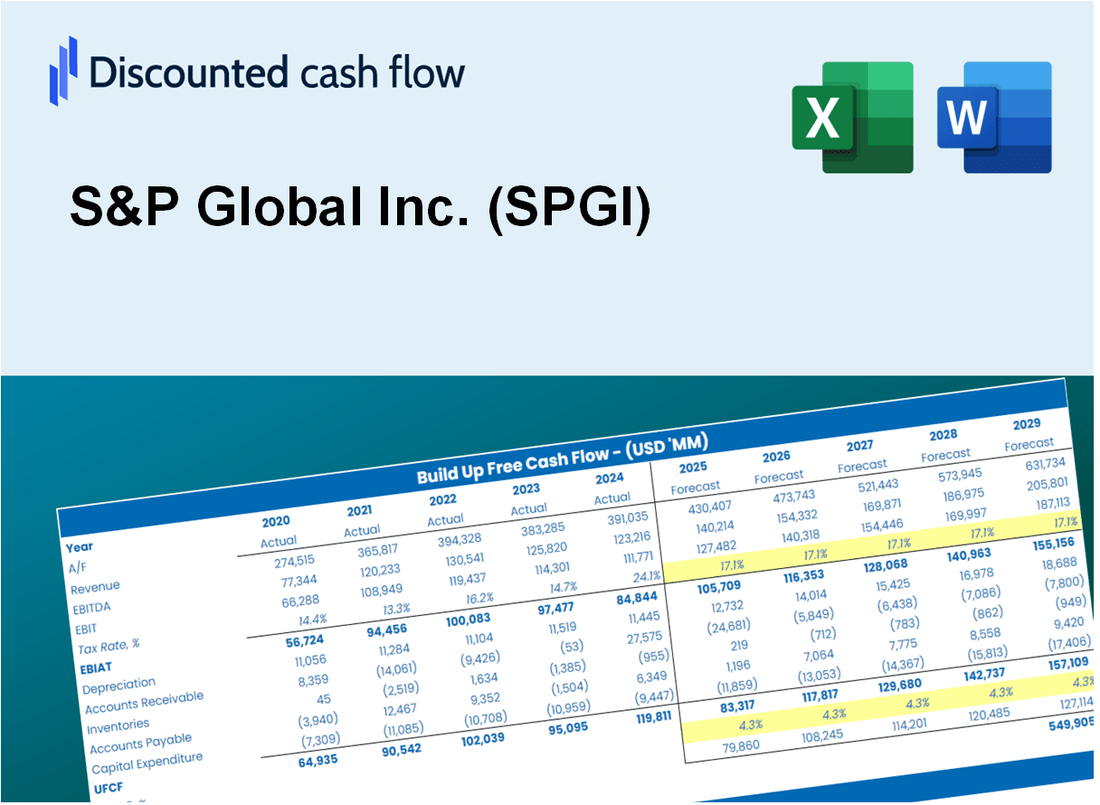
- Real S&P Global Data: Preloaded financials – from revenue to EBIT – based on actual and projected figures for S&P Global Inc. (SPGI).
- Full Customization: Adjust all critical parameters (yellow cells) like WACC, growth %, and tax rates tailored for S&P Global Inc. (SPGI).
- Instant Valuation Updates: Automatic recalculations to analyze the impact of changes on S&P Global Inc. (SPGI)’s fair value.
- Versatile Excel Template: Designed for quick edits, scenario testing, and detailed projections specific to S&P Global Inc. (SPGI).
- Time-Saving and Accurate: Avoid the hassle of building models from scratch while ensuring precision and flexibility for S&P Global Inc. (SPGI).
Key Features
- Comprehensive DCF Calculator: Features detailed unlevered and levered DCF valuation models tailored for S&P Global Inc. (SPGI).
- WACC Calculator: A pre-built Weighted Average Cost of Capital sheet with adjustable inputs specific to S&P Global Inc. (SPGI).
- Customizable Forecast Assumptions: Easily modify growth rates, capital expenditures, and discount rates relevant to S&P Global Inc. (SPGI).
- Integrated Financial Ratios: Evaluate profitability, leverage, and efficiency ratios for S&P Global Inc. (SPGI).
- Interactive Dashboard and Charts: Visual outputs that summarize key valuation metrics for S&P Global Inc. (SPGI) for straightforward analysis.
How It Works
- Step 1: Download the prebuilt Excel template featuring S&P Global Inc. (SPGI) data.
- Step 2: Navigate through the pre-filled sheets to familiarize yourself with the essential metrics.
- Step 3: Modify forecasts and assumptions in the editable yellow cells (WACC, growth, margins).
- Step 4: Instantly see the recalculated results, including S&P Global Inc.'s (SPGI) intrinsic value.
- Step 5: Make well-informed investment decisions or create reports based on the outputs.
Why Choose This Calculator for S&P Global Inc. (SPGI)?
- User-Friendly Interface: Perfectly crafted for both novices and seasoned professionals.
- Customizable Inputs: Adjust parameters effortlessly to suit your financial analysis.
- Real-Time Valuation: Observe immediate impacts on S&P Global’s valuation as you tweak inputs.
- Preloaded Data: Comes with S&P Global’s actual financial metrics for swift evaluations.
- Relied Upon by Experts: Utilized by investors and analysts for making strategic choices.
Who Should Use This Product?
- Investors: Evaluate S&P Global Inc.'s (SPGI) market position before making investment decisions.
- CFOs and Financial Analysts: Enhance financial modeling and analysis with S&P Global Inc. (SPGI) data.
- Corporate Strategists: Understand the valuation metrics of leading financial services companies like S&P Global Inc. (SPGI).
- Consultants: Provide clients with comprehensive valuation insights and reports based on S&P Global Inc. (SPGI).
- Students and Educators: Utilize current market data to teach and learn valuation methodologies using S&P Global Inc. (SPGI) as a case study.
What the Template Contains
- Pre-Filled DCF Model: S&P Global Inc.’s (SPGI) financial data preloaded for immediate use.
- WACC Calculator: Detailed calculations for Weighted Average Cost of Capital.
- Financial Ratios: Evaluate S&P Global Inc.’s (SPGI) profitability, leverage, and efficiency.
- Editable Inputs: Change assumptions such as growth, margins, and CAPEX to fit your scenarios.
- Financial Statements: Annual and quarterly reports to support detailed analysis.
- Interactive Dashboard: Easily visualize key valuation metrics and results.
Disclaimer
All information, articles, and product details provided on this website are for general informational and educational purposes only. We do not claim any ownership over, nor do we intend to infringe upon, any trademarks, copyrights, logos, brand names, or other intellectual property mentioned or depicted on this site. Such intellectual property remains the property of its respective owners, and any references here are made solely for identification or informational purposes, without implying any affiliation, endorsement, or partnership.
We make no representations or warranties, express or implied, regarding the accuracy, completeness, or suitability of any content or products presented. Nothing on this website should be construed as legal, tax, investment, financial, medical, or other professional advice. In addition, no part of this site—including articles or product references—constitutes a solicitation, recommendation, endorsement, advertisement, or offer to buy or sell any securities, franchises, or other financial instruments, particularly in jurisdictions where such activity would be unlawful.
All content is of a general nature and may not address the specific circumstances of any individual or entity. It is not a substitute for professional advice or services. Any actions you take based on the information provided here are strictly at your own risk. You accept full responsibility for any decisions or outcomes arising from your use of this website and agree to release us from any liability in connection with your use of, or reliance upon, the content or products found herein.