
|
Análisis de 5 Fuerzas de SPX Technologies, Inc. (SPXC) [Actualizado en Ene-2025] |
Completamente Editable: Adáptelo A Sus Necesidades En Excel O Sheets
Diseño Profesional: Plantillas Confiables Y Estándares De La Industria
Predeterminadas Para Un Uso Rápido Y Eficiente
Compatible con MAC / PC, completamente desbloqueado
No Se Necesita Experiencia; Fáciles De Seguir
SPX Technologies, Inc. (SPXC) Bundle
En el panorama dinámico de la tecnología industrial, SPX Technologies, Inc. (SPXC) navega por un complejo ecosistema de fuerzas competitivas que dan forma a su posicionamiento estratégico. Desde la intrincada danza de las negociaciones de proveedores hasta la incesante presión de las demandas de los clientes, este análisis revela la dinámica crítica del mercado que impulsa la estrategia competitiva de la compañía. Descubra cómo las tecnologías SPX equilibran la innovación tecnológica, los desafíos del mercado y la resistencia estratégica en un sector de tecnología industrial cada vez más competitiva.
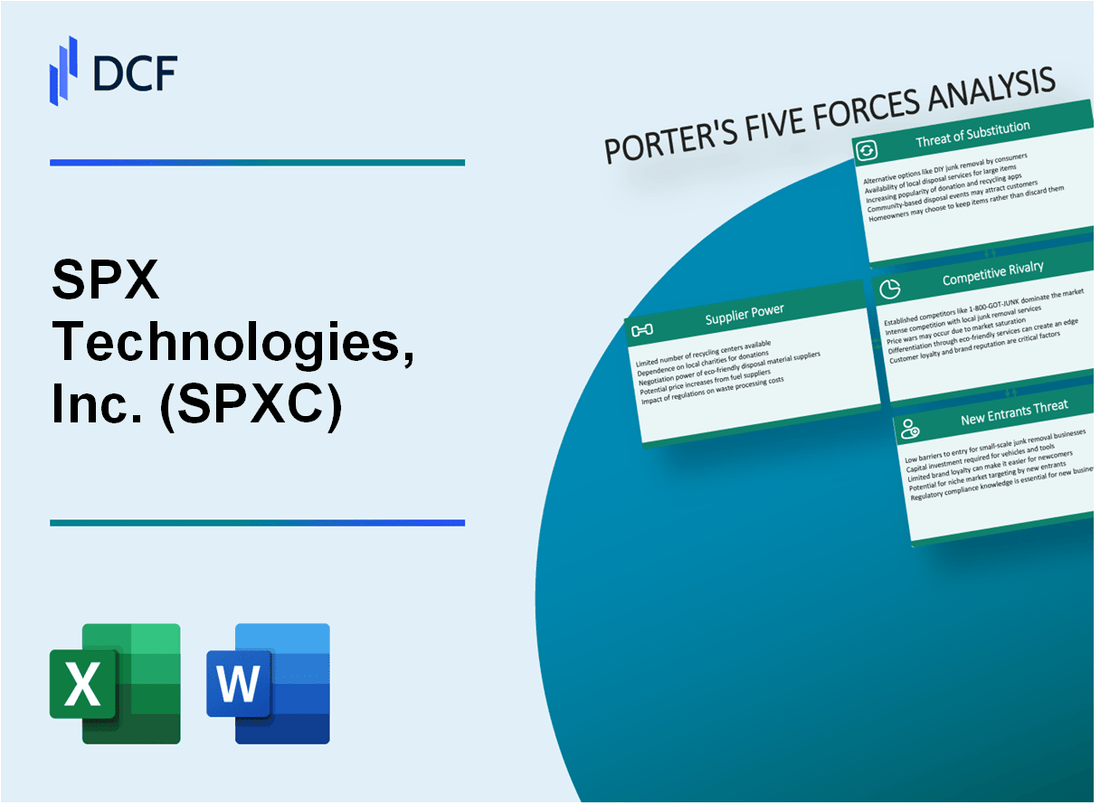
SPX Technologies, Inc. (SPXC) - Las cinco fuerzas de Porter: poder de negociación de los proveedores
Número limitado de fabricantes de equipos industriales especializados
A partir del cuarto trimestre de 2023, las tecnologías SPX identifican aproximadamente 7-12 proveedores críticos en fabricación de equipos industriales especializados. El mercado global de componentes de ingeniería de precisión muestra una relación de concentración del 65% entre los principales fabricantes.
| Categoría de proveedor | Número de proveedores | Concentración de mercado |
|---|---|---|
| Componentes de HVAC | 4-6 fabricantes globales | Cuota de mercado del 72% |
| Sistemas de detección | 3-5 proveedores especializados | Cuota de mercado del 58% |
Altos costos de conmutación para componentes críticos
Los costos de cambio de componentes críticos de HVAC y del sistema de detección oscilan entre $ 250,000 y $ 1.2 millones por línea de producción. Los procesos de recertificación y recalificación generalmente requieren 6-18 meses de validación de ingeniería.
- Costo de recertificación promedio: $ 475,000
- Cronología de validación de ingeniería: 9-14 meses
- Potencial interrupción de la producción: 3-6 meses
Concentración de proveedores en ingeniería de precisión
El sector de tecnología de ingeniería de precisión demuestra una concentración significativa de proveedores. Los 3 principales fabricantes globales controlan el 53% del mercado de componentes especializados a partir de 2023, con ingresos anuales que van desde $ 780 millones a $ 2.3 mil millones.
| Proveedor | Ingresos anuales | Cuota de mercado |
|---|---|---|
| Proveedor A | $ 2.1 mil millones | 22% |
| Proveedor B | $ 1.8 mil millones | 18% |
| Proveedor C | $ 1.3 mil millones | 13% |
Potencial de integración vertical
La posible estrategia de integración vertical de SPX Technologies podría reducir el apalancamiento de los proveedores en un estimado de 35-45%. El análisis de costos de producción de componentes internos indica posibles ahorros de $ 12-18 millones anuales.
- Inversión estimada de integración vertical: $ 45-65 millones
- FRUEGO DE ROI proyectado: 3-4 años
- Reducción de dependencia del proveedor potencial: 40%
SPX Technologies, Inc. (SPXC) - Cinco fuerzas de Porter: poder de negociación de los clientes
Diversidad de la base de clientes y poder adquisitivo
SPX Technologies atiende a múltiples segmentos de mercado con la siguiente distribución del cliente:
| Segmento de mercado | Porcentaje de la base de clientes |
|---|---|
| Mercados industriales | 42% |
| Sector energético | 28% |
| Infraestructura | 30% |
Gran concentración de clientes
Los 5 principales clientes de SPX Technologies representan el 37.5% de los ingresos anuales totales, lo que indica una concentración significativa del cliente.
Análisis de contrato de servicio a largo plazo
- Duración promedio del contrato: 3-5 años
- Rango de valor del contrato: $ 500,000 - $ 5.2 millones
- Cobertura de soporte técnico: 98% de los contratos a largo plazo
Métricas de sensibilidad de precios
| Categoría de productos | Elasticidad promedio de precios |
|---|---|
| Equipo industrial | 1.4 |
| Tecnologías de enfriamiento | 1.2 |
| Equipo de generación de energía | 0.9 |
Los clientes demuestran sensibilidad al precio moderada En todas las líneas de productos, con equipos industriales que muestran la mayor elasticidad de precios.
SPX Technologies, Inc. (SPXC) - Cinco fuerzas de Porter: rivalidad competitiva
Análisis de competencia de mercado
SPX Technologies opera en un panorama de tecnología industrial competitiva con la siguiente dinámica competitiva:
| Competidor | Segmento de mercado | Ingresos anuales (2023) |
|---|---|---|
| Carrier Global Corporation | Sistemas HVAC | $ 22.5 mil millones |
| Tecnologías de Trane | Soluciones climáticas | $ 17.3 mil millones |
| Honeywell International | Tecnología industrial | $ 35.6 mil millones |
| Tecnologías SPX | Tecnología industrial especializada | $ 1.56 mil millones |
Características del panorama competitivo
Las características competitivas clave incluyen:
- Nivel de concentración del mercado: moderado
- Tasa de consolidación de la industria: 4.2% anual
- Porcentaje de inversión de I + D: 3.7% de los ingresos
Factores de diferenciación tecnológica
Estrategias de diferenciación competitiva:
- Cartera de patentes: 127 patentes de tecnología industrial activa
- Especialización de ingeniería: Centrado en soluciones industriales de nicho
- Velocidad de adaptación del mercado: Ciclos de actualización de tecnología trimestral
Intensidad competitiva del mercado
| Factor competitivo | Nivel de intensidad |
|---|---|
| Número de competidores directos | 6-8 jugadores principales |
| Concentración de cuota de mercado | Las 3 empresas principales: 52% de participación de mercado |
| Competencia de precios | Moderado a alto |
SPX Technologies, Inc. (SPXC) - Cinco fuerzas de Porter: amenaza de sustitutos
Tecnologías alternativas emergentes en HVAC y sistemas de detección
A partir de 2024, el mercado de HVAC y sistemas de detección muestra cambios tecnológicos significativos. Según Market Research Future, se proyecta que el mercado global de HVAC inteligente alcanzará los $ 34.7 mil millones para 2027, con una tasa compuesta anual del 13.5%.
| Tipo de tecnología | Penetración del mercado (%) | Tasa de crecimiento proyectada |
|---|---|---|
| Sistemas HVAC con alimentación de IA | 22.3% | 16.2% CAGR |
| Redes de sensores inalámbricos | 18.7% | 14.9% CAGR |
| HVAC conectado a la nube | 15.6% | 12.5% CAGR |
Aumento de la adopción de soluciones de monitoreo digital y con IoT
La integración de IoT en los sistemas de detección demuestra una transformación sustancial del mercado. Gartner estima que 25 mil millones de dispositivos IoT estarán en uso para 2025.
- Valor de mercado del dispositivo IoT: $ 761.4 mil millones para 2026
- Crecimiento del mercado industrial de IoT: 22.7% anual
- Tamaño del mercado de mantenimiento predictivo: $ 12.9 mil millones en 2024
Alternativas de eficiencia energética desafiando el equipo tradicional
La eficiencia energética impulsa la sustitución tecnológica. El Departamento de Energía de EE. UU. Informa ahorros potenciales de energía del 30-50% a través de tecnologías avanzadas de HVAC.
| Tecnología de eficiencia energética | Ahorro de energía (%) | Costo de implementación |
|---|---|---|
| Sistemas de flujo de refrigerante variable | 35% | $15,000-$25,000 |
| Tecnologías de bomba de calor | 40% | $10,000-$20,000 |
| Sistemas termodinámicos inteligentes | 45% | $18,000-$30,000 |
Posible interrupción de sensores avanzados y tecnologías de diagnóstico
Las tecnologías de sensores avanzados demuestran un potencial de mercado significativo. Se espera que el mercado global de sensores alcance los $ 345.8 mil millones para 2027.
- Crecimiento del mercado del sensor de diagnóstico: 8.6% anual
- Inversión de tecnología de sensores mejorada con AI: $ 23.6 mil millones en 2024
- Mejora de precisión del diagnóstico predictivo: hasta el 92%
SPX Technologies, Inc. (SPXC) - Cinco fuerzas de Porter: amenaza de nuevos participantes
Altas barreras de entrada en mercados especializados de tecnología industrial
SPX Technologies enfrenta barreras de entrada sustanciales con una inversión inicial estimada de $ 75.3 millones para la penetración del mercado en sectores especializados de tecnología industrial. El gasto de I + D de la compañía en 2023 totalizó $ 112.4 millones, creando obstáculos significativos para posibles nuevos competidores.
| Categoría de costos de entrada al mercado | Inversión estimada ($ M) |
|---|---|
| Desarrollo de equipos iniciales | 42.6 |
| Cumplimiento regulatorio | 18.7 |
| Registro de patentes | 14.2 |
Requisitos de capital significativos para la investigación y el desarrollo
Las inversiones de I + D de SPX Technologies demuestran barreras financieras sustanciales:
- 2023 Gasto de I + D: $ 112.4 millones
- I + D como porcentaje de ingresos: 6.3%
- Portafolio de patentes totales: 287 patentes activas
Ingeniería compleja y experiencia técnica
La complejidad técnica crea barreras de entrada significativas con requisitos especializados de la fuerza laboral:
| Categoría de habilidades de ingeniería | Costo anual promedio por especialista |
|---|---|
| Especialista en ingeniería industrial senior | $145,000 |
| Ingeniero de Investigación de Tecnología Avanzada | $165,000 |
Carteras de patentes establecidas y protección de propiedad intelectual
SPX Technologies mantiene una protección de propiedad intelectual robusta:
- Patentes activas totales: 287
- Mantenimiento de patentes Costo anual: $ 3.2 millones
- Presupuesto de litigios de propiedad intelectual: $ 5.7 millones
Desafíos de cumplimiento regulatorio en sectores de equipos industriales
El cumplimiento regulatorio representa una importante barrera de entrada al mercado:
| Categoría de cumplimiento | Costo de cumplimiento anual ($ M) |
|---|---|
| Certificaciones de seguridad | 4.6 |
| Regulaciones ambientales | 3.9 |
| Estándares específicos de la industria | 2.8 |
SPX Technologies, Inc. (SPXC) - Porter's Five Forces: Competitive rivalry
The competitive rivalry within SPX Technologies, Inc.'s operating environment is high, you see this clearly when you look at the industrial players it goes up against. SPX Technologies, a global supplier of infrastructure equipment, faces established industrial giants in its core markets. The market demands constant performance; for instance, in the third quarter of 2025, the HVAC segment brought in $387.4 million in revenue, while Detection & Measurement posted $205.4 million. This level of revenue requires continuous product advancement to maintain or grow share.
SPX Technologies competes directly with specialized rivals. In the cooling space, it faces companies like Baltimore Aircoil Company (BAC). For its Detection & Measurement business, which includes communication technologies, a key rival mentioned is Rohde & Schwarz. The pressure to innovate is evident; SPX Technologies is pushing new products like the Olympus Max, which targets the rapidly growing data center cooling niche.
Both the HVAC and Detection & Measurement markets are mature, meaning market share gains are hard-won and require significant investment in R&D and operational excellence. The market is not forgiving of slow movers. To be fair, SPX Technologies is trading at a premium valuation, with shares trading at 45.7x earnings compared to the US Machinery average of 23.2x. This valuation gap suggests the market expects SPX Technologies to consistently out-innovate and out-execute its peers.
High exit barriers definitely exist in these manufacturing-heavy sectors due to the significant fixed assets and specialized manufacturing capacity required to produce engineered products like commercial self-contained units or underground pipe locators. Moving significant specialized production capacity is not like shutting down a software office; the sunk costs are substantial.
SPX Technologies' primary competitive tactic is a continuous, targeted Mergers & Acquisitions (M&A) strategy to bolster capabilities and market reach. This is a clear response to the competitive landscape. A recent example is the April 2025 acquisition of Sigma & Omega for approximately $144 million. This deal is expected to contribute about $65 million in annualized revenue for 2025 and strengthens the HVAC segment's hydronics business. Looking at the bigger picture, total M&A purchases in the first nine months of 2025 amounted to $445.3 million. This aggressive inorganic growth strategy is key to competing against larger, established players.
Here's a quick look at the M&A impact on the competitive strategy:
- Acquisition price for Sigma & Omega: $144 million
- Expected 2025 revenue contribution from Sigma & Omega: $65 million
- Total M&A spend (9M 2025): $445.3 million
- Detection & Measurement growth partially driven by KTS acquisition
- SPXC Q3 2025 Revenue: $592.8 million
The competitive intensity forces SPX Technologies to execute flawlessly on integration to realize the expected synergies and justify its premium market multiple. Finance: draft 13-week cash view by Friday.
SPX Technologies, Inc. (SPXC) - Porter's Five Forces: Threat of substitutes
The threat of substitutes for SPX Technologies, Inc. (SPXC) business remains moderate but is definitely evolving, driven by increasing energy efficiency mandates and the maturation of alternative technologies across both the HVAC and Detection & Measurement segments. You see this pressure most clearly in the cooling products space, where customers are actively evaluating options beyond the traditional installed base.
Customers in the HVAC segment can substitute traditional evaporative cooling towers with newer, high-efficiency adiabatic or dry cooling systems. This shift is fueled by water scarcity and energy cost concerns. While SPXC's core market is substantial, the growth of alternatives is notable:
| Metric | Value/Estimate | Year/Context |
|---|---|---|
| Global Energy-Saving Cooling Tower Market Value | $45 billion annually | Current estimate |
| Global Cooling Towers Market Value | USD 3.64 Bn | 2025 estimate |
| Evaporative Cooling Segment Market Share | 41.6% | 2025 estimate |
| Global Adiabatic Cooling Systems Market Value | USD 616.94 million | 2024 |
| Upfront Cost Premium for Adiabatic Units | 23% to 38% more | Compared to conventional air-cooled systems |
To counter this, SPXC is focusing on developing and pushing 'higher efficiency products' that blend the benefits of both technologies. A concrete example is the Olympus Max cooler, which is offered in both dry and adiabatic fluid cooler configurations. Management has set an aggressive target, noting they are on track to achieve $50 million of Olympus Max bookings in 2025, with that revenue expected to materialize in 2026.
For the Detection & Measurement segment, the threat involves substitution by newer infrastructure monitoring methods, such as satellite or drone-based solutions. While we don't have a direct market size for these substitutes, SPXC's strategy involves integrating digital solutions, evidenced by the growth in the segment, which saw revenue jump 38.4% in Q3 2025, partly due to the acquisition of KTS, which expands digital and communication technologies for critical infrastructure.
The mitigating factor creating high stickiness against immediate substitution is the installed base of long-life infrastructure equipment, like boilers and older cooling towers. Replacing these assets involves significant capital expenditure and operational disruption. For instance, industrial chiller replacement costs can start from £50,000 and exceed £100,000 depending on complexity. Furthermore, proactive water treatment programs for these assets can double or triple the useful equipment life, deferring replacement costs and protecting the existing investment.
- Energy-saving cooling towers maintain a significant market share due to established technology.
- Adiabatic systems offer up to 80% water usage reduction compared to traditional evaporative coolers.
- The Olympus Max design allows for in-field conversion from dry to adiabatic, offering a phased mitigation path for customers.
- D&M segment revenue guidance for full-year 2025 is set between $725-$745 million.
SPX Technologies, Inc. (SPXC) - Porter's Five Forces: Threat of new entrants
You're analyzing SPX Technologies, Inc. (SPXC) and wondering how easy it is for a new competitor to jump into their markets-HVAC and Detection & Measurement. Honestly, the threat of new entrants right now looks low to moderate, and that's primarily because the hurdles to entry are pretty high, both in terms of money and know-how.
New players definitely face significant capital requirements to even get started. Think about the scale SPX Technologies is operating at; in Q3 2025 alone, their capital expenditures were $10.4 million. To truly compete, a new entrant would need to match or exceed the kind of investment SPX Technologies is making to grow capacity. For instance, SPX Technologies is expanding its TAMCO facility in Tennessee, which is set to start production by the end of Q1 2026. That kind of manufacturing footprint costs serious cash.
The company itself has been aggressive in building scale through M&A, deploying approximately $2.1 billion in capital across 16 acquisitions since 2018. Plus, SPX Technologies just bolstered its financial position, increasing available liquidity to exceed $1.6 billion as of Q3 2025. You don't build that kind of war chest overnight, and a startup would struggle to raise that much just to compete on scale.
It's not just about the factory; it's about the relationships and reputation, too. Established brands create real distribution barriers. Take the Detection & Measurement segment, where the Radiodetection business unit is a leader. This unit, which includes trusted names like Schonstedt, serves customers in over 60 countries. SPX Technologies, as a whole, has operations in over 16 countries and a sales presence in 100 countries. Building that global channel network takes years, if not decades.
Then you have the technical complexity, especially for critical infrastructure equipment. New entrants need to navigate complex regulatory approvals and possess specialized engineering capabilities. SPX Technologies protects its core intellectual property fiercely, holding over 1,241 patent families. That's a massive moat built on innovation.
Here's a quick look at the scale of operations that new entrants must overcome:
| Metric | SPX Technologies Data (Late 2025) |
|---|---|
| Full Year 2025 Revenue Guidance (Midpoint) | $2.25 billion |
| Full Year 2025 Adjusted EBITDA Guidance (Midpoint) | $505 million |
| Q3 2025 Capital Expenditures | ($10.4 million) |
| Total Capital Deployed via M&A (Since 2018) | Approximately $2.1 billion |
| Total Patent Families Held | 1,241 |
The barriers are definitely structural, meaning they aren't easily overcome with just a better widget. New entrants must contend with SPX Technologies' entrenched market positions, which are supported by significant financial backing and proprietary technology.
The key barriers for any potential competitor include:
- High upfront capital for manufacturing scale.
- Long-term, trusted channel relationships globally.
- Complex regulatory compliance for utility gear.
- Extensive portfolio of protected intellectual property.
- Established brand equity in key niches like Radiodetection.
If someone wants to enter, they need deep pockets and a long-term view. That's just the reality of this industry. Finance: draft the capital expenditure forecast for the next two facility expansions by next Wednesday.
Disclaimer
All information, articles, and product details provided on this website are for general informational and educational purposes only. We do not claim any ownership over, nor do we intend to infringe upon, any trademarks, copyrights, logos, brand names, or other intellectual property mentioned or depicted on this site. Such intellectual property remains the property of its respective owners, and any references here are made solely for identification or informational purposes, without implying any affiliation, endorsement, or partnership.
We make no representations or warranties, express or implied, regarding the accuracy, completeness, or suitability of any content or products presented. Nothing on this website should be construed as legal, tax, investment, financial, medical, or other professional advice. In addition, no part of this site—including articles or product references—constitutes a solicitation, recommendation, endorsement, advertisement, or offer to buy or sell any securities, franchises, or other financial instruments, particularly in jurisdictions where such activity would be unlawful.
All content is of a general nature and may not address the specific circumstances of any individual or entity. It is not a substitute for professional advice or services. Any actions you take based on the information provided here are strictly at your own risk. You accept full responsibility for any decisions or outcomes arising from your use of this website and agree to release us from any liability in connection with your use of, or reliance upon, the content or products found herein.