
|
Valoración de DCF de Severn Trent PLC (SVT.L) |
Completamente Editable: Adáptelo A Sus Necesidades En Excel O Sheets
Diseño Profesional: Plantillas Confiables Y Estándares De La Industria
Predeterminadas Para Un Uso Rápido Y Eficiente
Compatible con MAC / PC, completamente desbloqueado
No Se Necesita Experiencia; Fáciles De Seguir
Severn Trent Plc (SVT.L) Bundle
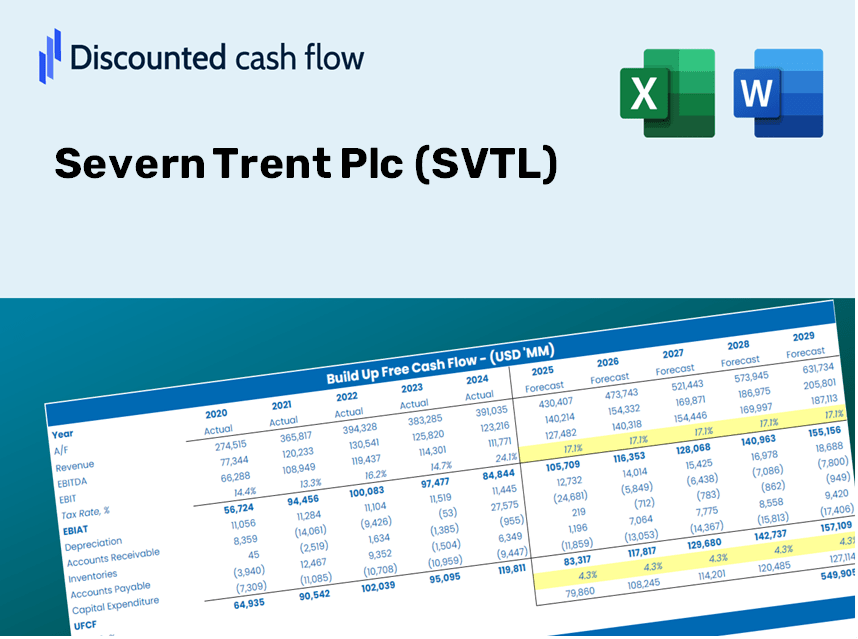
¡Simplifique la valoración de Severn Trent Plc (SVTL) con esta calculadora DCF personalizable! Con el Real Severn Trent Plc (SVTL) financieros y las entradas de pronóstico ajustables, puede probar escenarios y descubrir el valor razonable de Severn Trent PLC (SVTL) en minutos.
Discounted Cash Flow (DCF) - (USD MM)
| Year | AY1 2021 |
AY2 2022 |
AY3 2023 |
AY4 2024 |
AY5 2025 |
FY1 2026 |
FY2 2027 |
FY3 2028 |
FY4 2029 |
FY5 2030 |
|---|---|---|---|---|---|---|---|---|---|---|
| Revenue | 1,827.2 | 1,943.3 | 2,165.1 | 2,338.2 | 2,426.7 | 2,606.0 | 2,798.5 | 3,005.2 | 3,227.2 | 3,465.6 |
| Revenue Growth, % | 0 | 6.35 | 11.41 | 8 | 3.78 | 7.39 | 7.39 | 7.39 | 7.39 | 7.39 |
| EBITDA | 891.5 | 997.4 | 1,030.6 | 886.7 | 1,156.9 | 1,216.0 | 1,305.8 | 1,402.3 | 1,505.9 | 1,617.1 |
| EBITDA, % | 48.79 | 51.33 | 47.6 | 37.92 | 47.67 | 46.66 | 46.66 | 46.66 | 46.66 | 46.66 |
| Depreciation | 379.8 | 401.6 | 417.3 | 390.8 | 454.4 | 501.2 | 538.2 | 578.0 | 620.7 | 666.5 |
| Depreciation, % | 20.79 | 20.67 | 19.27 | 16.71 | 18.73 | 19.23 | 19.23 | 19.23 | 19.23 | 19.23 |
| EBIT | 511.7 | 595.8 | 613.3 | 495.9 | 702.5 | 714.8 | 767.6 | 824.3 | 885.2 | 950.6 |
| EBIT, % | 28 | 30.66 | 28.33 | 21.21 | 28.95 | 27.43 | 27.43 | 27.43 | 27.43 | 27.43 |
| Total Cash | 56.2 | 115.4 | 34.2 | 953.2 | 1,022.2 | 487.2 | 523.2 | 561.9 | 603.4 | 647.9 |
| Total Cash, percent | .0 | .0 | .0 | .0 | .0 | .0 | .0 | .0 | .0 | .0 |
| Account Receivables | 246.0 | 257.6 | 338.7 | 364.0 | 843.0 | 483.0 | 518.7 | 557.0 | 598.1 | 642.3 |
| Account Receivables, % | 13.46 | 13.26 | 15.64 | 15.57 | 34.74 | 18.53 | 18.53 | 18.53 | 18.53 | 18.53 |
| Inventories | 30.8 | 32.0 | 35.4 | 40.1 | 43.2 | 44.1 | 47.4 | 50.9 | 54.6 | 58.7 |
| Inventories, % | 1.69 | 1.65 | 1.64 | 1.71 | 1.78 | 1.69 | 1.69 | 1.69 | 1.69 | 1.69 |
| Accounts Payable | 40.8 | 89.1 | 122.7 | 162.5 | 173.5 | 138.6 | 148.8 | 159.8 | 171.6 | 184.3 |
| Accounts Payable, % | 2.23 | 4.58 | 5.67 | 6.95 | 7.15 | 5.32 | 5.32 | 5.32 | 5.32 | 5.32 |
| Capital Expenditure | -636.6 | -646.6 | -739.7 | -1,169.7 | -1,592.8 | -1,135.9 | -1,219.8 | -1,309.9 | -1,406.7 | -1,510.6 |
| Capital Expenditure, % | -34.84 | -33.27 | -34.16 | -50.03 | -65.64 | -43.59 | -43.59 | -43.59 | -43.59 | -43.59 |
| Tax Rate, % | 28.33 | 28.33 | 28.33 | 28.33 | 28.33 | 28.33 | 28.33 | 28.33 | 28.33 | 28.33 |
| EBITAT | 386.4 | -188.0 | 482.9 | 345.4 | 503.4 | 422.5 | 453.8 | 487.3 | 523.3 | 561.9 |
| Depreciation | ||||||||||
| Changes in Account Receivables | ||||||||||
| Changes in Inventories | ||||||||||
| Changes in Accounts Payable | ||||||||||
| Capital Expenditure | ||||||||||
| UFCF | -106.4 | -397.5 | 109.6 | -423.7 | -1,106.1 | 112.0 | -256.5 | -275.5 | -295.8 | -317.7 |
| WACC, % | 4.09 | 2.44 | 4.16 | 3.96 | 4 | 3.73 | 3.73 | 3.73 | 3.73 | 3.73 |
| PV UFCF | ||||||||||
| SUM PV UFCF | -897.3 | |||||||||
| Long Term Growth Rate, % | 4.00 | |||||||||
| Free cash flow (T + 1) | -330 | |||||||||
| Terminal Value | 121,504 | |||||||||
| Present Terminal Value | 101,183 | |||||||||
| Enterprise Value | 100,286 | |||||||||
| Net Debt | 8,675 | |||||||||
| Equity Value | 91,611 | |||||||||
| Diluted Shares Outstanding, MM | 300 | |||||||||
| Equity Value Per Share | 30,516.67 |
Benefits You Will Receive
- Comprehensive Financial Model: Actual data from Severn Trent Plc (SVTL) enables accurate DCF valuation.
- Complete Forecast Customization: Modify revenue growth, profit margins, WACC, and other essential factors.
- Real-Time Calculations: Instantaneous updates let you view results as adjustments are made.
- Professional-Grade Template: A polished Excel file built for high-quality valuation presentations.
- Flexible and Reusable: Designed for adaptability, allowing consistent application for in-depth forecasts.
Key Features
- Advanced DCF Calculator: Features comprehensive unlevered and levered DCF valuation models tailored for Severn Trent Plc (SVTL).
- WACC Calculator: Comes with a pre-configured Weighted Average Cost of Capital spreadsheet that allows for customizable inputs.
- Editable Forecast Assumptions: Adjust growth rates, capital expenditures, and discount rates to fit your analysis needs.
- Built-In Financial Ratios: Evaluate profitability, leverage, and efficiency ratios specifically for Severn Trent Plc (SVTL).
- Dashboard and Charts: Offers visual representations that summarize essential valuation metrics for streamlined analysis.
How It Functions
- 1. Access the Template: Download and open the Excel file containing Severn Trent Plc’s (SVTL) preloaded data.
- 2. Modify Assumptions: Adjust key parameters such as growth rates, WACC, and capital expenditures.
- 3. Observe Results in Real Time: The DCF model automatically computes intrinsic value and NPV.
- 4. Explore Different Scenarios: Evaluate various forecasts to understand different valuation results.
- 5. Utilize with Assurance: Present expert valuation insights to reinforce your decision-making.
Why Choose This Calculator for Severn Trent Plc (SVTL)?
- Precision: Utilizes actual Severn Trent financial data for reliable results.
- Versatility: Tailored for users to easily explore and adjust inputs.
- Efficiency: Eliminate the complexity of creating a DCF model from the ground up.
- High-Quality: Crafted with the accuracy and usability expected by financial professionals.
- Intuitive: Designed to be accessible for users with varying levels of financial expertise.
Who Can Benefit from Severn Trent Plc (SVTL)?
- Investors: Make informed choices with a sophisticated valuation tool designed for precision.
- Financial Analysts: Streamline your workflow with a customizable pre-built DCF model.
- Consultants: Easily tailor the template for impactful client presentations and reports.
- Finance Enthusiasts: Enhance your expertise in valuation methods through practical, real-world examples.
- Educators and Students: Leverage it as an effective educational resource in finance courses.
Contents of the Template
- Historical Data: Contains Severn Trent Plc’s (SVTL) past financial results and projections.
- Discounted Cash Flow Model: An editable DCF valuation model with automatic calculating features.
- Weighted Average Cost of Capital (WACC): A specific sheet for WACC calculation using custom parameters.
- Essential Financial Ratios: Evaluate Severn Trent Plc’s (SVTL) efficiency, profitability, and leverage metrics.
- Customizable Variables: Easily modify revenue growth rates, margins, and tax percentages.
- User-Friendly Dashboard: Visual representations and tables that summarize vital valuation data.
Disclaimer
All information, articles, and product details provided on this website are for general informational and educational purposes only. We do not claim any ownership over, nor do we intend to infringe upon, any trademarks, copyrights, logos, brand names, or other intellectual property mentioned or depicted on this site. Such intellectual property remains the property of its respective owners, and any references here are made solely for identification or informational purposes, without implying any affiliation, endorsement, or partnership.
We make no representations or warranties, express or implied, regarding the accuracy, completeness, or suitability of any content or products presented. Nothing on this website should be construed as legal, tax, investment, financial, medical, or other professional advice. In addition, no part of this site—including articles or product references—constitutes a solicitation, recommendation, endorsement, advertisement, or offer to buy or sell any securities, franchises, or other financial instruments, particularly in jurisdictions where such activity would be unlawful.
All content is of a general nature and may not address the specific circumstances of any individual or entity. It is not a substitute for professional advice or services. Any actions you take based on the information provided here are strictly at your own risk. You accept full responsibility for any decisions or outcomes arising from your use of this website and agree to release us from any liability in connection with your use of, or reliance upon, the content or products found herein.