
|
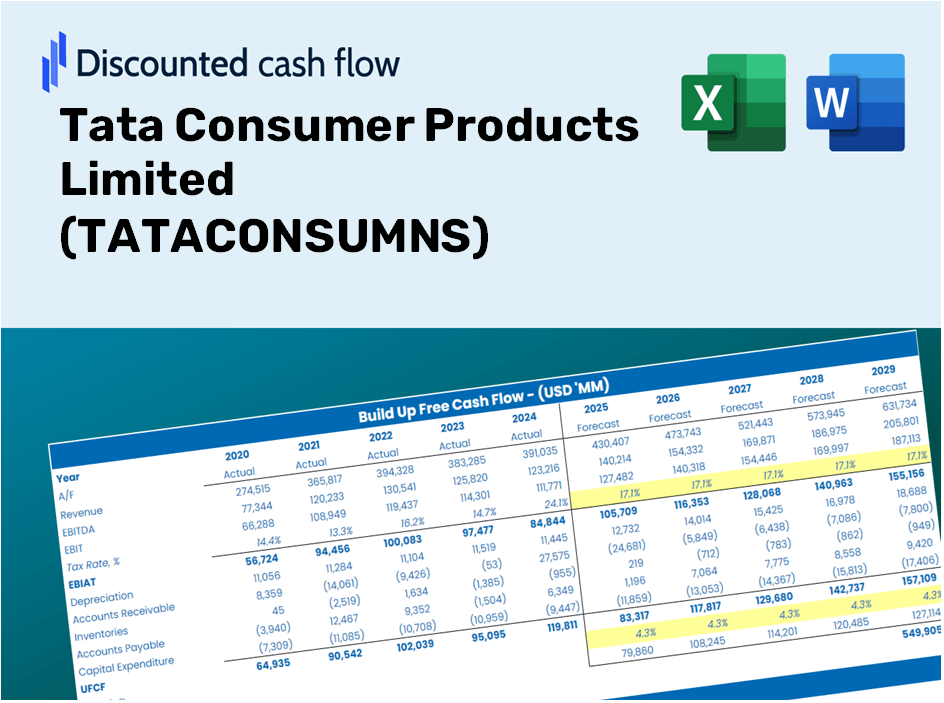
Tata Consumer Products Limited (Tataconsum.NS) DCF Valoración |
Completamente Editable: Adáptelo A Sus Necesidades En Excel O Sheets
Diseño Profesional: Plantillas Confiables Y Estándares De La Industria
Predeterminadas Para Un Uso Rápido Y Eficiente
Compatible con MAC / PC, completamente desbloqueado
No Se Necesita Experiencia; Fáciles De Seguir
Tata Consumer Products Limited (TATACONSUM.NS) Bundle
¡Mejore sus estrategias de inversión con la calculadora DCF (Tataconsumns)! Utilice datos financieros del consumidor genuino de TATA, ajuste las proyecciones y gastos de crecimiento, y observe cómo estas modificaciones influyen en el valor intrínseco de (Tataconsumns) en tiempo real.
What You Will Receive
- Pre-Filled Financial Model: Tata Consumer Products Limited’s actual data enables accurate DCF valuation.
- Full Forecast Control: Modify revenue growth, profit margins, WACC, and other essential drivers.
- Instant Calculations: Automatic updates provide real-time results as changes are made.
- Investor-Ready Template: A polished Excel file crafted for high-quality valuation.
- Customizable and Reusable: Designed for versatility, allowing repeated application for comprehensive forecasts.
Key Features
- Authentic Tata Financial Data: Gain access to precise, pre-loaded historical figures along with forward-looking projections for Tata Consumer Products Limited (TATACONSUMNS).
- Tailorable Forecast Parameters: Modify yellow-highlighted fields, including WACC, growth rates, and profit margins.
- Real-Time Calculations: Enjoy automatic updates for DCF, Net Present Value (NPV), and cash flow assessments.
- Interactive Visual Dashboard: User-friendly charts and summaries to effectively illustrate your valuation insights.
- Designed for All Skill Levels: An intuitive layout tailored for investors, CFOs, and consultants, suitable for both novices and experts.
How It Works
- Step 1: Download the Excel file.
- Step 2: Review the pre-filled data for Tata Consumer Products Limited (TATACONSUMNS) including historical and forecasted figures.
- Step 3: Modify key assumptions in the designated yellow cells based on your insights.
- Step 4: Observe the automatic recalculations reflecting Tata Consumer Products Limited's (TATACONSUMNS) intrinsic value.
- Step 5: Utilize the results to inform your investment strategies or reporting.
Why Choose This Calculator for Tata Consumer Products Limited (TATACONSUMNS)?
- Reliable Data: Utilize authentic Tata Consumer financials for dependable valuation outcomes.
- Customizable Features: Tailor essential metrics such as growth rates, WACC, and tax rates to fit your forecasts.
- Efficiency Boost: Built-in calculations save you time and eliminate the hassle of starting from scratch.
- Professional-Quality Tool: Crafted for use by investors, financial analysts, and consultants.
- User-Friendly Interface: Easy-to-navigate design and clear step-by-step guidance cater to all users.
Who Should Use This Product?
- Finance Students: Acquire skills in valuation methods and apply them to real-world data.
- Academics: Integrate advanced financial models into your lectures or research projects.
- Investors: Test your hypotheses and examine valuation results for Tata Consumer Products Limited (TATACONSUMNS).
- Analysts: Enhance your efficiency with a customizable, ready-made DCF model.
- Small Business Owners: Understand how major public companies like Tata Consumer Products Limited are evaluated.
Contents of the Template
- Pre-Filled DCF Model: Tata Consumer Products Limited’s (TATACONSUMNS) financial data preloaded for immediate analysis.
- WACC Calculator: Comprehensive calculations for the Weighted Average Cost of Capital.
- Financial Ratios: Assess Tata Consumer Products Limited’s (TATACONSUMNS) profitability, leverage, and operational efficiency.
- Editable Inputs: Modify assumptions like growth rates, profit margins, and capital expenditures to fit your needs.
- Financial Statements: Access annual and quarterly reports for in-depth evaluation.
- Interactive Dashboard: Effortlessly visualize key valuation metrics and outcomes.
Disclaimer
All information, articles, and product details provided on this website are for general informational and educational purposes only. We do not claim any ownership over, nor do we intend to infringe upon, any trademarks, copyrights, logos, brand names, or other intellectual property mentioned or depicted on this site. Such intellectual property remains the property of its respective owners, and any references here are made solely for identification or informational purposes, without implying any affiliation, endorsement, or partnership.
We make no representations or warranties, express or implied, regarding the accuracy, completeness, or suitability of any content or products presented. Nothing on this website should be construed as legal, tax, investment, financial, medical, or other professional advice. In addition, no part of this site—including articles or product references—constitutes a solicitation, recommendation, endorsement, advertisement, or offer to buy or sell any securities, franchises, or other financial instruments, particularly in jurisdictions where such activity would be unlawful.
All content is of a general nature and may not address the specific circumstances of any individual or entity. It is not a substitute for professional advice or services. Any actions you take based on the information provided here are strictly at your own risk. You accept full responsibility for any decisions or outcomes arising from your use of this website and agree to release us from any liability in connection with your use of, or reliance upon, the content or products found herein.