
|
Valoración DCF de Theravance Biopharma, Inc. (TBPH) |
Completamente Editable: Adáptelo A Sus Necesidades En Excel O Sheets
Diseño Profesional: Plantillas Confiables Y Estándares De La Industria
Predeterminadas Para Un Uso Rápido Y Eficiente
Compatible con MAC / PC, completamente desbloqueado
No Se Necesita Experiencia; Fáciles De Seguir
Theravance Biopharma, Inc. (TBPH) Bundle
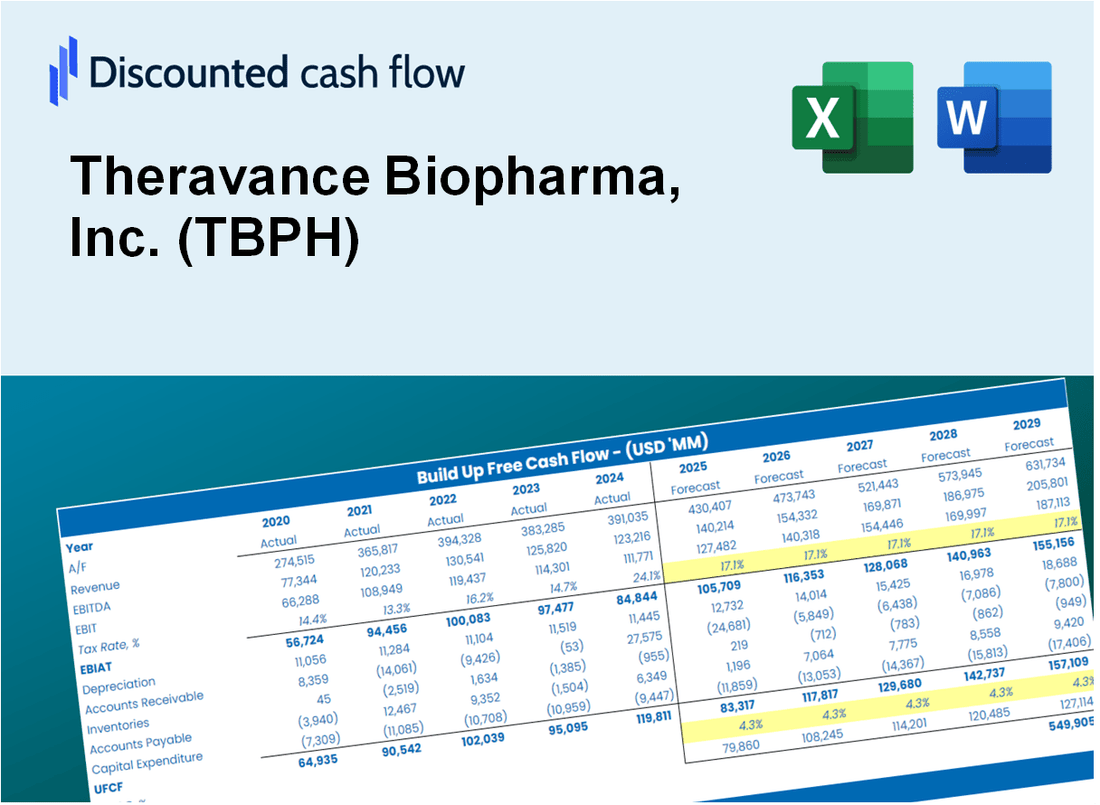
Diseñada para la precisión, nuestra calculadora DCF (TBPH) le permite evaluar la valoración de Theravance BioPharma, Inc. utilizando datos financieros del mundo real y una flexibilidad completa para modificar todos los parámetros clave para las proyecciones mejoradas.
Discounted Cash Flow (DCF) - (USD MM)
| Year | AY1 2020 |
AY2 2021 |
AY3 2022 |
AY4 2023 |
AY5 2024 |
FY1 2025 |
FY2 2026 |
FY3 2027 |
FY4 2028 |
FY5 2029 |
|---|---|---|---|---|---|---|---|---|---|---|
| Revenue | 71.9 | 55.3 | 51.3 | 57.4 | 64.4 | 63.4 | 62.4 | 61.4 | 60.5 | 59.5 |
| Revenue Growth, % | 0 | -23.03 | -7.17 | 11.84 | 12.12 | -1.56 | -1.56 | -1.56 | -1.56 | -1.56 |
| EBITDA | -287.8 | -232.8 | -76.1 | -51.6 | -38.5 | -57.0 | -56.1 | -55.2 | -54.4 | -53.5 |
| EBITDA, % | -400.55 | -420.95 | -148.18 | -89.94 | -59.73 | -89.93 | -89.93 | -89.93 | -89.93 | -89.93 |
| Depreciation | 7.0 | 4.8 | 3.0 | 2.0 | 3.6 | 4.2 | 4.2 | 4.1 | 4.0 | 4.0 |
| Depreciation, % | 9.7 | 8.7 | 5.91 | 3.48 | 5.62 | 6.68 | 6.68 | 6.68 | 6.68 | 6.68 |
| EBIT | -294.8 | -237.6 | -79.1 | -53.6 | -42.1 | -58.2 | -57.2 | -56.3 | -55.5 | -54.6 |
| EBIT, % | -410.25 | -429.65 | -154.09 | -93.43 | -65.34 | -91.75 | -91.75 | -91.75 | -91.75 | -91.75 |
| Total Cash | 292.9 | 173.5 | 327.5 | 102.4 | 88.4 | 63.4 | 62.4 | 61.4 | 60.5 | 59.5 |
| Total Cash, percent | .0 | .0 | .0 | .0 | .0 | .0 | .0 | .0 | .0 | .0 |
| Account Receivables | 69.7 | 57.6 | 16.8 | 17.5 | 68.4 | 45.6 | 44.9 | 44.2 | 43.5 | 42.9 |
| Account Receivables, % | 96.95 | 104.14 | 32.69 | 30.43 | 106.3 | 72.01 | 72.01 | 72.01 | 72.01 | 72.01 |
| Inventories | .0 | .0 | .0 | .0 | .0 | .0 | .0 | .0 | .0 | .0 |
| Inventories, % | 0 | 0 | 0 | 0 | 0 | 0 | 0 | 0 | 0 | 0 |
| Accounts Payable | 6.8 | 3.1 | 1.6 | 1.5 | 2.2 | 3.1 | 3.0 | 3.0 | 2.9 | 2.9 |
| Accounts Payable, % | 9.43 | 5.6 | 3.03 | 2.65 | 3.48 | 4.84 | 4.84 | 4.84 | 4.84 | 4.84 |
| Capital Expenditure | -6.6 | -3.4 | -.6 | -2.5 | -.3 | -2.7 | -2.7 | -2.6 | -2.6 | -2.5 |
| Capital Expenditure, % | -9.21 | -6.16 | -1.11 | -4.33 | -0.51568 | -4.27 | -4.27 | -4.27 | -4.27 | -4.27 |
| Tax Rate, % | -26.46 | -26.46 | -26.46 | -26.46 | -26.46 | -26.46 | -26.46 | -26.46 | -26.46 | -26.46 |
| EBITAT | -270.2 | -178.7 | 743.4 | -60.1 | -53.2 | -42.7 | -42.0 | -41.3 | -40.7 | -40.1 |
| Depreciation | ||||||||||
| Changes in Account Receivables | ||||||||||
| Changes in Inventories | ||||||||||
| Changes in Accounts Payable | ||||||||||
| Capital Expenditure | ||||||||||
| UFCF | -332.7 | -168.9 | 785.2 | -61.3 | -100.2 | -17.5 | -39.8 | -39.2 | -38.6 | -38.0 |
| WACC, % | 4.68 | 4.64 | 4.42 | 4.71 | 4.71 | 4.63 | 4.63 | 4.63 | 4.63 | 4.63 |
| PV UFCF | ||||||||||
| SUM PV UFCF | -149.8 | |||||||||
| Long Term Growth Rate, % | 2.00 | |||||||||
| Free cash flow (T + 1) | -39 | |||||||||
| Terminal Value | -1,472 | |||||||||
| Present Terminal Value | -1,174 | |||||||||
| Enterprise Value | -1,324 | |||||||||
| Net Debt | 12 | |||||||||
| Equity Value | -1,336 | |||||||||
| Diluted Shares Outstanding, MM | 49 | |||||||||
| Equity Value Per Share | -27.34 |
What You Will Get
- Real Theravance Data: Preloaded financials – from revenue to EBIT – based on actual and projected figures for Theravance Biopharma, Inc. (TBPH).
- Full Customization: Adjust all critical parameters (yellow cells) such as WACC, growth %, and tax rates to fit your analysis.
- Instant Valuation Updates: Automatic recalculations to assess the impact of changes on Theravance’s fair value.
- Versatile Excel Template: Designed for quick edits, scenario testing, and comprehensive projections tailored to Theravance Biopharma, Inc. (TBPH).
- Time-Saving and Accurate: Avoid building models from scratch while ensuring precision and flexibility in your evaluations.
Key Features
- Real-Time TBPH Data: Pre-filled with Theravance Biopharma’s historical financials and future growth projections.
- Fully Customizable Inputs: Modify revenue growth rates, profit margins, discount rates, tax obligations, and capital investments.
- Dynamic Valuation Model: Instant updates to Net Present Value (NPV) and intrinsic value based on your specified inputs.
- Scenario Analysis: Develop various forecast scenarios to evaluate different valuation results.
- User-Friendly Interface: Intuitive, organized, and suitable for both experts and newcomers.
How It Works
- Step 1: Download the Excel file.
- Step 2: Review pre-entered Theravance Biopharma data (historical and projected).
- Step 3: Adjust key assumptions (yellow cells) based on your analysis.
- Step 4: View automatic recalculations for Theravance Biopharma’s intrinsic value.
- Step 5: Use the outputs for investment decisions or reporting.
Why Choose This Calculator for Theravance Biopharma, Inc. (TBPH)?
- Comprehensive Tool: Integrates DCF, WACC, and financial ratio analyses tailored for biotech firms.
- Customizable Inputs: Modify yellow-highlighted cells to explore different financial scenarios.
- Detailed Insights: Automatically computes Theravance’s intrinsic value and Net Present Value.
- Preloaded Data: Access to historical and projected data for precise analysis.
- Professional Quality: Perfect for financial analysts, investors, and biotech consultants.
Who Should Use This Product?
- Investors: Evaluate Theravance Biopharma’s valuation before making stock trades.
- CFOs and Financial Analysts: Optimize valuation methodologies and assess financial forecasts.
- Startup Founders: Discover how large biotech firms like Theravance Biopharma are appraised.
- Consultants: Provide comprehensive valuation reports for clients in the biotech sector.
- Students and Educators: Utilize real-time data to practice and instruct on valuation strategies.
What the Template Contains
- Pre-Filled Data: Includes Theravance Biopharma's historical financials and forecasts.
- Discounted Cash Flow Model: Editable DCF valuation model with automatic calculations.
- Weighted Average Cost of Capital (WACC): A dedicated sheet for calculating WACC based on custom inputs.
- Key Financial Ratios: Analyze Theravance Biopharma's profitability, efficiency, and leverage.
- Customizable Inputs: Edit revenue growth, margins, and tax rates with ease.
- Clear Dashboard: Charts and tables summarizing key valuation results.
Disclaimer
All information, articles, and product details provided on this website are for general informational and educational purposes only. We do not claim any ownership over, nor do we intend to infringe upon, any trademarks, copyrights, logos, brand names, or other intellectual property mentioned or depicted on this site. Such intellectual property remains the property of its respective owners, and any references here are made solely for identification or informational purposes, without implying any affiliation, endorsement, or partnership.
We make no representations or warranties, express or implied, regarding the accuracy, completeness, or suitability of any content or products presented. Nothing on this website should be construed as legal, tax, investment, financial, medical, or other professional advice. In addition, no part of this site—including articles or product references—constitutes a solicitation, recommendation, endorsement, advertisement, or offer to buy or sell any securities, franchises, or other financial instruments, particularly in jurisdictions where such activity would be unlawful.
All content is of a general nature and may not address the specific circumstances of any individual or entity. It is not a substitute for professional advice or services. Any actions you take based on the information provided here are strictly at your own risk. You accept full responsibility for any decisions or outcomes arising from your use of this website and agree to release us from any liability in connection with your use of, or reliance upon, the content or products found herein.