
|
Valoración de DCF Timken India Limited (Timken.NS) |
Completamente Editable: Adáptelo A Sus Necesidades En Excel O Sheets
Diseño Profesional: Plantillas Confiables Y Estándares De La Industria
Predeterminadas Para Un Uso Rápido Y Eficiente
Compatible con MAC / PC, completamente desbloqueado
No Se Necesita Experiencia; Fáciles De Seguir
Timken India Limited (TIMKEN.NS) Bundle
¡Mejore sus opciones de inversión con la calculadora DCF de Timken India Limited (Timkenns)! Sumérgete en la auténtica financiación de Timken India, ajusta las predicciones y gastos de crecimiento, y observa cómo estas modificaciones influyen en el valor intrínseco de Timken India Limited (Timkenns) en tiempo real.
What You Will Receive
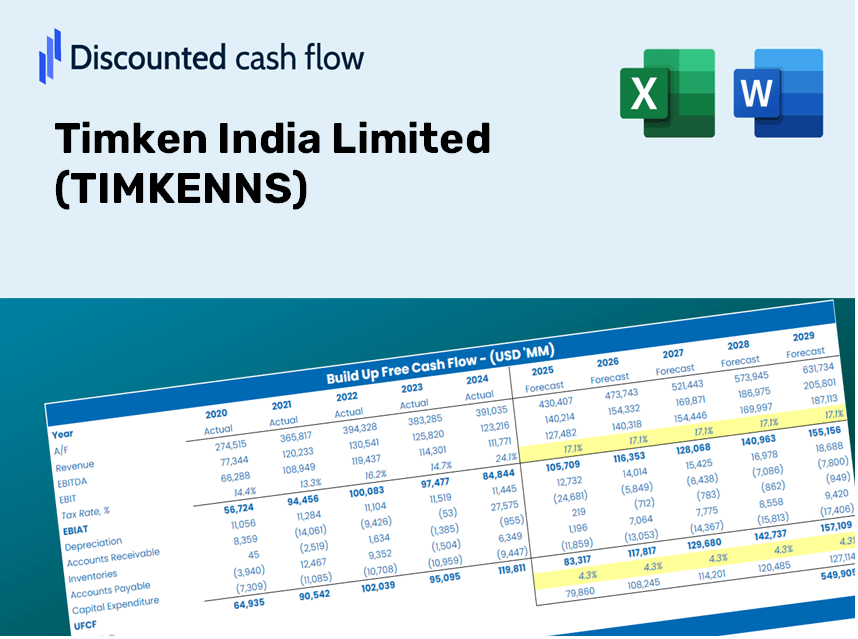
- Authentic Timken Data: Preloaded financials – encompassing revenue to EBIT – derived from actual and projected figures for Timken India Limited (TIMKENNS).
- Comprehensive Customization: Modify all essential parameters (yellow cells) such as WACC, growth %, and tax rates to suit your analysis.
- Real-Time Valuation Updates: Automatic recalculations to assess the effects of changes on the fair value of Timken India Limited (TIMKENNS).
- Flexible Excel Template: Designed for easy modifications, scenario analysis, and in-depth forecasts.
- Efficient and Precise: Eliminate the need to create models from the ground up while ensuring accuracy and adaptability.
Key Features
- Advanced DCF Calculator: Features comprehensive unlevered and levered DCF valuation models tailored for Timken India Limited (TIMKENNS).
- WACC Calculator: Comes with a pre-designed Weighted Average Cost of Capital sheet that allows for customizable inputs specific to (TIMKENNS).
- Editable Forecast Assumptions: Adjust growth rates, capital expenditures, and discount rates to suit the financial outlook of Timken India Limited (TIMKENNS).
- Built-In Financial Ratios: Evaluate profitability, leverage, and efficiency ratios relevant to Timken India Limited (TIMKENNS).
- Dashboard and Charts: Visual representations that consolidate key valuation metrics for straightforward analysis of (TIMKENNS).
How It Works
- Step 1: Download the Excel file for Timken India Limited (TIMKENNS).
- Step 2: Examine the pre-filled financial data and forecasts for Timken India Limited (TIMKENNS).
- Step 3: Adjust key inputs such as revenue growth, WACC, and tax rates (highlighted cells).
- Step 4: Observe the DCF model update in real-time as you modify your assumptions.
- Step 5: Review the outputs and leverage the findings for your investment strategies regarding Timken India Limited (TIMKENNS).
Why Choose This Calculator for Timken India Limited (TIMKENNS)?
- Precise Data: Utilize authentic financial figures from Timken India for trustworthy valuation outcomes.
- Tailored Options: Modify essential metrics such as growth rates, WACC, and tax rates to align with your forecasts.
- Efficiency Boost: Ready-to-use calculations save you the hassle of starting from the ground up.
- Professional-Quality Tool: Crafted specifically for investors, analysts, and consultants in the industry.
- Easy to Use: With a straightforward design and guided steps, it's accessible for users at any level.
Who Can Benefit from Timken India Limited (TIMKENNS)?
- Investors: Enhance your investment strategies with a reliable and professional valuation tool.
- Financial Analysts: Streamline your workflow with a customizable pre-built DCF model tailored for analysis.
- Consultants: Effortlessly modify the template for impactful client presentations and reports.
- Finance Enthusiasts: Expand your knowledge of valuation methods through practical real-world applications.
- Educators and Students: Utilize this resource as a hands-on learning tool in finance-focused coursework.
Contents of the Template
- Detailed DCF Model: Editable template featuring thorough valuation computations.
- Real-Time Data: Timken India Limited's historical and forecasted financials preloaded for assessment.
- Customizable Inputs: Modify WACC, growth rates, and tax assumptions to explore different scenarios.
- Financial Statements: Complete annual and quarterly financial breakdowns for enhanced insights.
- Key Performance Ratios: Integrated analysis for profitability, efficiency, and leverage metrics.
- Interactive Dashboard with Visual Outputs: Graphs and tables for clear, actionable insights.
Disclaimer
All information, articles, and product details provided on this website are for general informational and educational purposes only. We do not claim any ownership over, nor do we intend to infringe upon, any trademarks, copyrights, logos, brand names, or other intellectual property mentioned or depicted on this site. Such intellectual property remains the property of its respective owners, and any references here are made solely for identification or informational purposes, without implying any affiliation, endorsement, or partnership.
We make no representations or warranties, express or implied, regarding the accuracy, completeness, or suitability of any content or products presented. Nothing on this website should be construed as legal, tax, investment, financial, medical, or other professional advice. In addition, no part of this site—including articles or product references—constitutes a solicitation, recommendation, endorsement, advertisement, or offer to buy or sell any securities, franchises, or other financial instruments, particularly in jurisdictions where such activity would be unlawful.
All content is of a general nature and may not address the specific circumstances of any individual or entity. It is not a substitute for professional advice or services. Any actions you take based on the information provided here are strictly at your own risk. You accept full responsibility for any decisions or outcomes arising from your use of this website and agree to release us from any liability in connection with your use of, or reliance upon, the content or products found herein.