
|
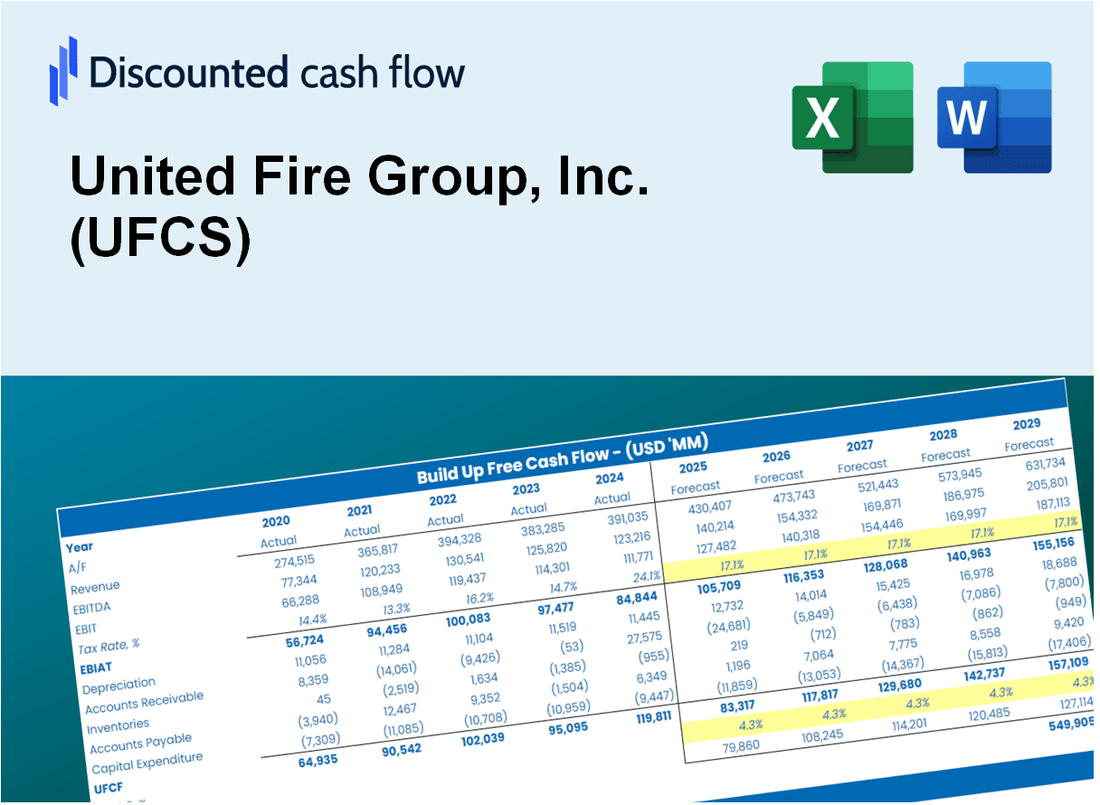
Valoración DCF de United Fire Group, Inc. (UFCS) |
Completamente Editable: Adáptelo A Sus Necesidades En Excel O Sheets
Diseño Profesional: Plantillas Confiables Y Estándares De La Industria
Predeterminadas Para Un Uso Rápido Y Eficiente
Compatible con MAC / PC, completamente desbloqueado
No Se Necesita Experiencia; Fáciles De Seguir
United Fire Group, Inc. (UFCS) Bundle
¡Mejore su estrategia de inversión con la calculadora DCF de United Fire Group, Inc. (UFCS)! Revise los datos financieros auténticos para United Fire Group, ajuste las proyecciones y gastos de crecimiento, y observe instantáneamente cómo estos cambios afectan el valor intrínseco de United Fire Group, Inc. (UFCS).
What You Will Receive
- Customizable Excel Template: A fully adjustable Excel-based DCF Calculator featuring pre-filled actual UFCS financials.
- Accurate Data: Historical performance data and forward-looking projections (highlighted in the yellow cells).
- Assumption Adjustability: Modify forecast parameters such as revenue growth, EBITDA %, and WACC.
- Real-Time Calculations: Instantly observe how your inputs influence United Fire Group's valuation.
- Professional Resource: Designed for investors, CFOs, consultants, and financial analysts.
- Intuitive Layout: Organized for clarity and ease of navigation, complete with step-by-step guidance.
Key Features
- Comprehensive UFCS Data: Pre-loaded with United Fire Group, Inc.'s historical financial performance and future forecasts.
- Customizable Assumptions: Modify growth rates, expense ratios, discount rates, tax considerations, and capital investments.
- Interactive Valuation Tool: Real-time updates to Net Present Value (NPV) and intrinsic valuation based on your adjustments.
- Scenario Analysis: Develop various forecasting scenarios to evaluate different valuation possibilities.
- Intuitive Interface: Designed to be straightforward and accessible for both industry experts and newcomers.
How It Works
- Download: Get the pre-built Excel file featuring United Fire Group, Inc.'s (UFCS) financial data.
- Customize: Modify forecasts such as revenue growth, EBITDA %, and WACC to suit your analysis.
- Update Automatically: The intrinsic value and NPV calculations refresh in real-time as you make changes.
- Test Scenarios: Generate various projections and instantly compare the results.
- Make Decisions: Leverage the valuation insights to inform your investment strategy.
Why Choose This Calculator for United Fire Group, Inc. (UFCS)?
- User-Friendly Interface: Tailored for both novices and seasoned professionals.
- Customizable Inputs: Adjust parameters easily to align with your financial analysis.
- Real-Time Adjustments: Observe immediate changes to United Fire Group's valuation as you modify inputs.
- Preloaded Data: Comes equipped with United Fire Group’s actual financial metrics for swift evaluations.
- Relied Upon by Experts: Favored by investors and analysts for making well-informed choices.
Who Should Use This Product?
- Professional Investors: Develop comprehensive and trustworthy valuation models for assessing United Fire Group, Inc. (UFCS).
- Corporate Finance Teams: Evaluate valuation scenarios to inform strategic decisions within the organization.
- Consultants and Advisors: Deliver precise valuation insights to clients regarding United Fire Group, Inc. (UFCS).
- Students and Educators: Utilize real-world data to enhance learning and practice in financial modeling.
- Insurance Industry Analysts: Gain insights into the valuation and performance of insurance companies like United Fire Group, Inc. (UFCS).
What the Template Contains
- Preloaded UFCS Data: Historical and projected financial data, including revenue, EBIT, and capital expenditures.
- DCF and WACC Models: Professional-grade sheets for calculating intrinsic value and Weighted Average Cost of Capital.
- Editable Inputs: Yellow-highlighted cells for adjusting revenue growth, tax rates, and discount rates.
- Financial Statements: Comprehensive annual and quarterly financials for deeper analysis.
- Key Ratios: Profitability, leverage, and efficiency ratios to evaluate performance.
- Dashboard and Charts: Visual summaries of valuation outcomes and assumptions.
Disclaimer
All information, articles, and product details provided on this website are for general informational and educational purposes only. We do not claim any ownership over, nor do we intend to infringe upon, any trademarks, copyrights, logos, brand names, or other intellectual property mentioned or depicted on this site. Such intellectual property remains the property of its respective owners, and any references here are made solely for identification or informational purposes, without implying any affiliation, endorsement, or partnership.
We make no representations or warranties, express or implied, regarding the accuracy, completeness, or suitability of any content or products presented. Nothing on this website should be construed as legal, tax, investment, financial, medical, or other professional advice. In addition, no part of this site—including articles or product references—constitutes a solicitation, recommendation, endorsement, advertisement, or offer to buy or sell any securities, franchises, or other financial instruments, particularly in jurisdictions where such activity would be unlawful.
All content is of a general nature and may not address the specific circumstances of any individual or entity. It is not a substitute for professional advice or services. Any actions you take based on the information provided here are strictly at your own risk. You accept full responsibility for any decisions or outcomes arising from your use of this website and agree to release us from any liability in connection with your use of, or reliance upon, the content or products found herein.