
|
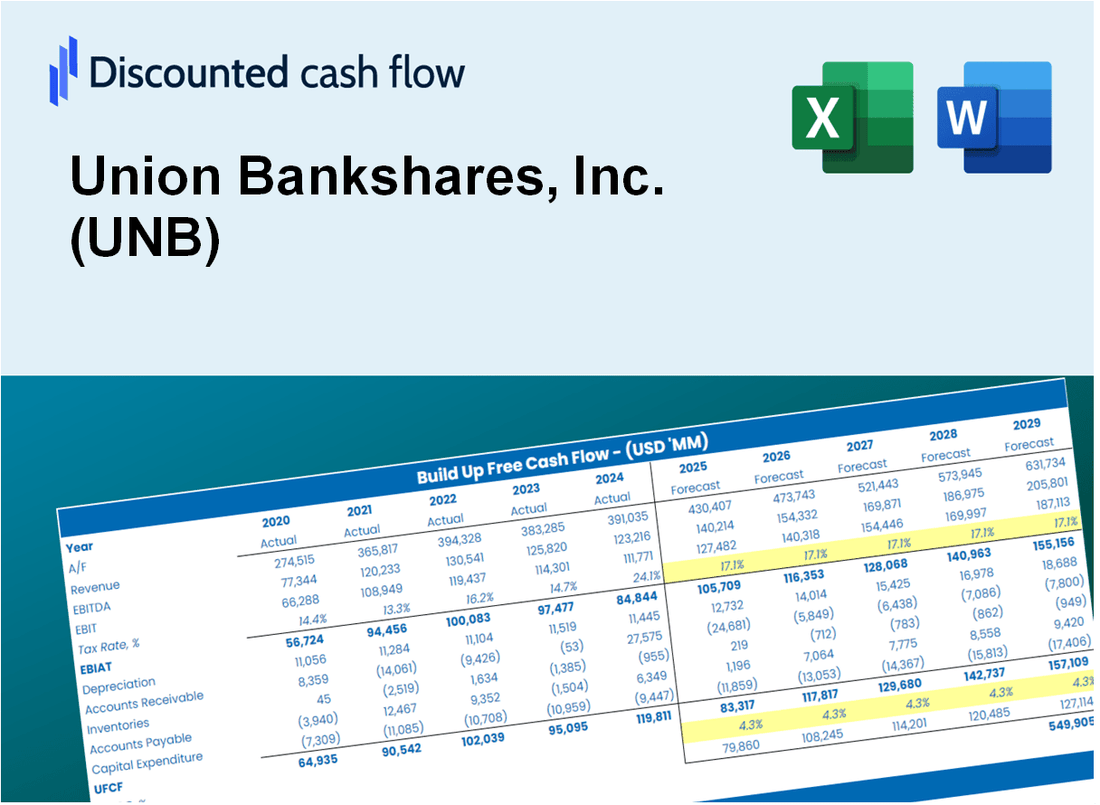
Valoración DCF de Union Bankshares, Inc. (UNB) |
Completamente Editable: Adáptelo A Sus Necesidades En Excel O Sheets
Diseño Profesional: Plantillas Confiables Y Estándares De La Industria
Predeterminadas Para Un Uso Rápido Y Eficiente
Compatible con MAC / PC, completamente desbloqueado
No Se Necesita Experiencia; Fáciles De Seguir
Union Bankshares, Inc. (UNB) Bundle
¡Descubra el verdadero potencial de Union Bankshares, Inc. (UNB) con nuestra calculadora DCF avanzada! Ajuste los supuestos clave, explore varios escenarios y evalúe cómo los diferentes cambios afectan a Union Bankshares, Inc. (UNB) Valoración, todo dentro de una plantilla de Excel integral.
Discounted Cash Flow (DCF) - (USD MM)
| Year | AY1 2020 |
AY2 2021 |
AY3 2022 |
AY4 2023 |
AY5 2024 |
FY1 2025 |
FY2 2026 |
FY3 2027 |
FY4 2028 |
FY5 2029 |
|---|---|---|---|---|---|---|---|---|---|---|
| Revenue | 52.0 | 51.3 | 52.4 | 66.1 | 76.4 | 84.6 | 93.6 | 103.5 | 114.6 | 126.8 |
| Revenue Growth, % | 0 | -1.18 | 2.11 | 26.1 | 15.6 | 10.66 | 10.66 | 10.66 | 10.66 | 10.66 |
| EBITDA | 17.3 | 17.7 | 17.0 | 14.5 | 10.7 | 23.0 | 25.5 | 28.2 | 31.2 | 34.6 |
| EBITDA, % | 33.27 | 34.5 | 32.52 | 21.96 | 14.03 | 27.26 | 27.26 | 27.26 | 27.26 | 27.26 |
| Depreciation | 2.1 | 1.9 | 1.8 | 1.6 | 1.6 | 2.6 | 2.9 | 3.2 | 3.6 | 4.0 |
| Depreciation, % | 3.97 | 3.69 | 3.44 | 2.48 | 2.08 | 3.13 | 3.13 | 3.13 | 3.13 | 3.13 |
| EBIT | 15.2 | 15.8 | 15.2 | 12.9 | 9.1 | 20.4 | 22.6 | 25.0 | 27.6 | 30.6 |
| EBIT, % | 29.3 | 30.81 | 29.09 | 19.48 | 11.95 | 24.12 | 24.12 | 24.12 | 24.12 | 24.12 |
| Total Cash | 123.9 | 285.7 | 271.2 | 283.5 | 188.9 | 84.6 | 93.6 | 103.5 | 114.6 | 126.8 |
| Total Cash, percent | .0 | .0 | .0 | .0 | .0 | .0 | .0 | .0 | .0 | .0 |
| Account Receivables | .0 | .0 | .0 | .0 | .0 | .0 | .0 | .0 | .0 | .0 |
| Account Receivables, % | 0 | 0 | 0 | 0 | 0 | 0 | 0 | 0 | 0 | 0 |
| Inventories | .0 | .0 | .0 | .0 | .0 | .0 | .0 | .0 | .0 | .0 |
| Inventories, % | 0 | 0 | 0 | 0 | 0 | 0 | 0 | 0 | 0 | 0 |
| Accounts Payable | 11.2 | 9.8 | 13.2 | .0 | .0 | 11.1 | 12.3 | 13.6 | 15.1 | 16.7 |
| Accounts Payable, % | 21.6 | 19.05 | 25.09 | 0 | 0 | 13.15 | 13.15 | 13.15 | 13.15 | 13.15 |
| Capital Expenditure | -1.0 | -3.5 | -.7 | -1.9 | -1.1 | -2.4 | -2.7 | -3.0 | -3.3 | -3.6 |
| Capital Expenditure, % | -1.94 | -6.84 | -1.27 | -2.94 | -1.4 | -2.88 | -2.88 | -2.88 | -2.88 | -2.88 |
| Tax Rate, % | 4.04 | 4.04 | 4.04 | 4.04 | 4.04 | 4.04 | 4.04 | 4.04 | 4.04 | 4.04 |
| EBITAT | 12.8 | 13.2 | 12.6 | 11.3 | 8.8 | 17.7 | 19.6 | 21.7 | 24.0 | 26.5 |
| Depreciation | ||||||||||
| Changes in Account Receivables | ||||||||||
| Changes in Inventories | ||||||||||
| Changes in Accounts Payable | ||||||||||
| Capital Expenditure | ||||||||||
| UFCF | 25.1 | 10.1 | 17.1 | -2.2 | 9.3 | 29.0 | 21.0 | 23.2 | 25.7 | 28.4 |
| WACC, % | 8.05 | 7.98 | 7.94 | 8.31 | 8.98 | 8.25 | 8.25 | 8.25 | 8.25 | 8.25 |
| PV UFCF | ||||||||||
| SUM PV UFCF | 100.9 | |||||||||
| Long Term Growth Rate, % | 2.00 | |||||||||
| Free cash flow (T + 1) | 29 | |||||||||
| Terminal Value | 464 | |||||||||
| Present Terminal Value | 312 | |||||||||
| Enterprise Value | 413 | |||||||||
| Net Debt | 261 | |||||||||
| Equity Value | 152 | |||||||||
| Diluted Shares Outstanding, MM | 5 | |||||||||
| Equity Value Per Share | 33.35 |
What You Will Get
- Editable Excel Template: A fully customizable Excel-based DCF Calculator featuring pre-filled real UNB financials.
- Real-World Data: Historical data and forward-looking estimates (as highlighted in the yellow cells).
- Forecast Flexibility: Adjust forecast assumptions such as revenue growth, EBITDA %, and WACC.
- Automatic Calculations: Instantly observe the effect of your inputs on Union Bankshares, Inc.'s valuation.
- Professional Tool: Designed for investors, CFOs, consultants, and financial analysts.
- User-Friendly Design: Organized for clarity and ease of use, complete with step-by-step instructions.
Key Features
- Comprehensive DCF Calculator: Offers detailed unlevered and levered DCF valuation models tailored for Union Bankshares, Inc. (UNB).
- WACC Tool: Pre-configured Weighted Average Cost of Capital sheet with adjustable inputs specific to Union Bankshares, Inc. (UNB).
- Customizable Forecast Assumptions: Adjust growth projections, capital investments, and discount rates as needed for Union Bankshares, Inc. (UNB).
- Integrated Financial Ratios: Evaluate profitability, leverage, and efficiency ratios relevant to Union Bankshares, Inc. (UNB).
- Interactive Dashboard and Charts: Visual representations of key valuation metrics for straightforward analysis of Union Bankshares, Inc. (UNB).
How It Works
- Step 1: Download the Excel file.
- Step 2: Review pre-entered Union Bankshares, Inc. (UNB) data (historical and projected).
- Step 3: Adjust key assumptions (yellow cells) based on your analysis.
- Step 4: View automatic recalculations for Union Bankshares, Inc. (UNB)’s intrinsic value.
- Step 5: Use the outputs for investment decisions or reporting.
Why Choose This Calculator for Union Bankshares, Inc. (UNB)?
- Accuracy: Utilizes real Union Bankshares financial data for precise calculations.
- Flexibility: Allows users to easily test and adjust inputs as needed.
- Time-Saving: Eliminates the need to create a DCF model from the ground up.
- Professional-Grade: Crafted with the expertise and attention to detail expected at the CFO level.
- User-Friendly: Intuitive design makes it accessible for users without extensive financial modeling skills.
Who Should Use This Product?
- Finance Students: Explore financial modeling techniques and apply them to real-world data for Union Bankshares, Inc. (UNB).
- Academics: Integrate advanced valuation models into your studies or research projects focused on Union Bankshares, Inc. (UNB).
- Investors: Validate your investment strategies and assess valuation scenarios for Union Bankshares, Inc. (UNB).
- Analysts: Enhance your efficiency with a customizable DCF model specifically designed for Union Bankshares, Inc. (UNB).
- Small Business Owners: Understand the analytical frameworks used for evaluating larger financial institutions like Union Bankshares, Inc. (UNB).
What the Template Contains
- Operating and Balance Sheet Data: Pre-filled Union Bankshares, Inc. (UNB) historical data and forecasts, including revenue, EBITDA, EBIT, and capital expenditures.
- WACC Calculation: A dedicated sheet for Weighted Average Cost of Capital (WACC), including parameters like Beta, risk-free rate, and share price.
- DCF Valuation (Unlevered and Levered): Editable Discounted Cash Flow models showing intrinsic value with detailed calculations.
- Financial Statements: Pre-loaded financial statements (annual and quarterly) to support analysis.
- Key Ratios: Includes profitability, leverage, and efficiency ratios for Union Bankshares, Inc. (UNB).
- Dashboard and Charts: Visual summary of valuation outputs and assumptions to analyze results easily.
Disclaimer
All information, articles, and product details provided on this website are for general informational and educational purposes only. We do not claim any ownership over, nor do we intend to infringe upon, any trademarks, copyrights, logos, brand names, or other intellectual property mentioned or depicted on this site. Such intellectual property remains the property of its respective owners, and any references here are made solely for identification or informational purposes, without implying any affiliation, endorsement, or partnership.
We make no representations or warranties, express or implied, regarding the accuracy, completeness, or suitability of any content or products presented. Nothing on this website should be construed as legal, tax, investment, financial, medical, or other professional advice. In addition, no part of this site—including articles or product references—constitutes a solicitation, recommendation, endorsement, advertisement, or offer to buy or sell any securities, franchises, or other financial instruments, particularly in jurisdictions where such activity would be unlawful.
All content is of a general nature and may not address the specific circumstances of any individual or entity. It is not a substitute for professional advice or services. Any actions you take based on the information provided here are strictly at your own risk. You accept full responsibility for any decisions or outcomes arising from your use of this website and agree to release us from any liability in connection with your use of, or reliance upon, the content or products found herein.