
|
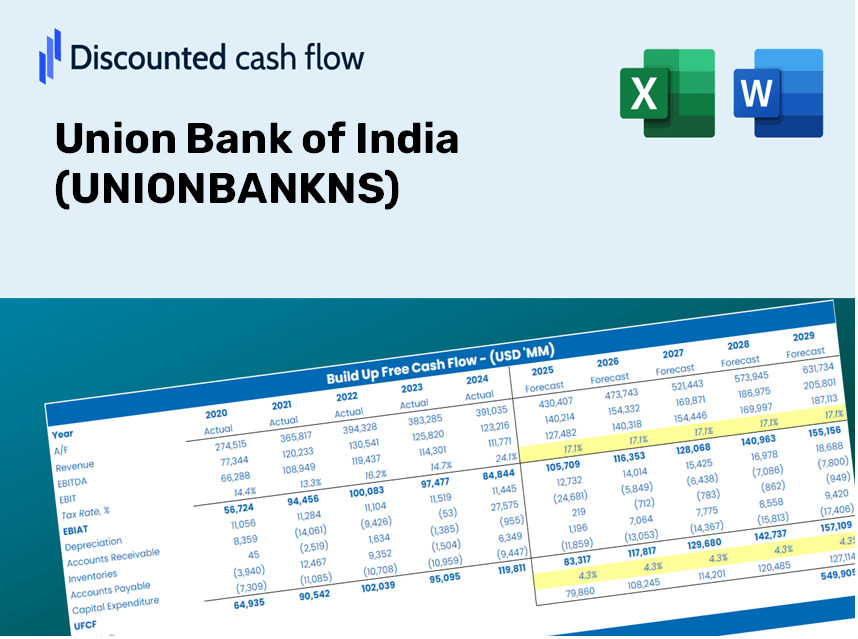
Union Bank of India (UnionBank.NS) Valoración de DCF |
Completamente Editable: Adáptelo A Sus Necesidades En Excel O Sheets
Diseño Profesional: Plantillas Confiables Y Estándares De La Industria
Predeterminadas Para Un Uso Rápido Y Eficiente
Compatible con MAC / PC, completamente desbloqueado
No Se Necesita Experiencia; Fáciles De Seguir
Union Bank of India (UNIONBANK.NS) Bundle
¡Descubra el verdadero potencial de Union Bank of India con nuestra calculadora DCF avanzada! Ajuste los supuestos clave, explore varios escenarios y evalúe los efectos de los cambios en la valoración de Union Bank of India, todo dentro de una sola plantilla de Excel.
Discounted Cash Flow (DCF) - (USD MM)
| Year | AY1 2021 |
AY2 2022 |
AY3 2023 |
AY4 2024 |
AY5 2025 |
FY1 2026 |
FY2 2027 |
FY3 2028 |
FY4 2029 |
FY5 2030 |
|---|---|---|---|---|---|---|---|---|---|---|
| Revenue | 831,655.0 | 817,544.2 | 951,644.9 | 1,185,413.9 | 1,299,792.5 | 1,458,756.2 | 1,637,161.0 | 1,837,384.6 | 2,062,095.5 | 2,314,288.3 |
| Revenue Growth, % | 0 | -1.7 | 16.4 | 24.56 | 9.65 | 12.23 | 12.23 | 12.23 | 12.23 | 12.23 |
| EBITDA | 42,370.1 | 93,044.3 | 128,910.3 | 224,923.3 | 245,077.6 | 197,956.3 | 222,166.2 | 249,337.0 | 279,830.7 | 314,053.8 |
| EBITDA, % | 5.09 | 11.38 | 13.55 | 18.97 | 18.86 | 13.57 | 13.57 | 13.57 | 13.57 | 13.57 |
| Depreciation | 9,081.5 | 7,448.1 | 7,445.7 | 8,959.3 | 10,838.8 | 12,764.4 | 14,325.5 | 16,077.5 | 18,043.8 | 20,250.5 |
| Depreciation, % | 1.09 | 0.91104 | 0.7824 | 0.7558 | 0.83389 | 0.87502 | 0.87502 | 0.87502 | 0.87502 | 0.87502 |
| EBIT | 33,288.6 | 85,596.2 | 121,464.7 | 215,964.0 | 234,238.8 | 185,191.9 | 207,840.7 | 233,259.5 | 261,786.9 | 293,803.3 |
| EBIT, % | 4 | 10.47 | 12.76 | 18.22 | 18.02 | 12.7 | 12.7 | 12.7 | 12.7 | 12.7 |
| Total Cash | 847,633.4 | 1,197,582.2 | 1,125,988.7 | 1,196,458.5 | 1,316,837.4 | 1,458,756.2 | 1,637,161.0 | 1,837,384.6 | 2,062,095.5 | 2,314,288.3 |
| Total Cash, percent | .0 | .0 | .0 | .0 | .0 | .0 | .0 | .0 | .0 | .0 |
| Account Receivables | 102,833.5 | 116,499.8 | 124,891.4 | 144,682.7 | 147,646.0 | 184,687.5 | 207,274.7 | 232,624.2 | 261,074.0 | 293,003.2 |
| Account Receivables, % | 12.36 | 14.25 | 13.12 | 12.21 | 11.36 | 12.66 | 12.66 | 12.66 | 12.66 | 12.66 |
| Inventories | .0 | -1,329,464.1 | -1,285,471.6 | -673,698.1 | .0 | -749,311.4 | -840,951.7 | -943,799.5 | -1,059,225.5 | -1,188,768.0 |
| Inventories, % | 0 | -162.62 | -135.08 | -56.83 | 0 | -51.37 | -51.37 | -51.37 | -51.37 | -51.37 |
| Accounts Payable | 31,807.5 | 45,494.1 | 60,343.3 | 52,476.4 | 63,611.2 | 73,086.8 | 82,025.3 | 92,056.9 | 103,315.4 | 115,950.8 |
| Accounts Payable, % | 3.82 | 5.56 | 6.34 | 4.43 | 4.89 | 5.01 | 5.01 | 5.01 | 5.01 | 5.01 |
| Capital Expenditure | -7,189.8 | -7,495.3 | -30,655.5 | -16,488.0 | -16,691.7 | -22,399.9 | -25,139.4 | -28,213.9 | -31,664.4 | -35,537.0 |
| Capital Expenditure, % | -0.86452 | -0.91681 | -3.22 | -1.39 | -1.28 | -1.54 | -1.54 | -1.54 | -1.54 | -1.54 |
| Tax Rate, % | 23.39 | 23.39 | 23.39 | 23.39 | 23.39 | 23.39 | 23.39 | 23.39 | 23.39 | 23.39 |
| EBITAT | 28,332.9 | 52,265.2 | 84,550.0 | 137,971.1 | 179,459.1 | 131,961.0 | 148,099.7 | 166,212.2 | 186,539.8 | 209,353.5 |
| Depreciation | ||||||||||
| Changes in Account Receivables | ||||||||||
| Changes in Inventories | ||||||||||
| Changes in Accounts Payable | ||||||||||
| Capital Expenditure | ||||||||||
| UFCF | -40,801.4 | 1,381,702.4 | 23,805.3 | -508,989.4 | -491,920.3 | 844,071.0 | 215,277.4 | 241,605.7 | 271,153.9 | 304,315.8 |
| WACC, % | 50.26 | 37.98 | 42.34 | 39.42 | 45.92 | 43.19 | 43.19 | 43.19 | 43.19 | 43.19 |
| PV UFCF | ||||||||||
| SUM PV UFCF | 891,867.9 | |||||||||
| Long Term Growth Rate, % | 2.00 | |||||||||
| Free cash flow (T + 1) | 310,402 | |||||||||
| Terminal Value | 753,664 | |||||||||
| Present Terminal Value | 125,221 | |||||||||
| Enterprise Value | 1,017,089 | |||||||||
| Net Debt | -1,041,940 | |||||||||
| Equity Value | 2,059,029 | |||||||||
| Diluted Shares Outstanding, MM | 7,203 | |||||||||
| Equity Value Per Share | 285.85 |
What You Will Receive
- Adjustable Forecast Assumptions: Effortlessly modify key inputs (growth %, margins, WACC) to develop various scenarios.
- Comprehensive Financial Data: Union Bank of India’s financial metrics pre-loaded to facilitate your analysis.
- Automated DCF Calculations: The template computes Net Present Value (NPV) and intrinsic value automatically.
- Customizable and Professional Interface: A refined Excel model tailored to meet your valuation requirements.
- Designed for Analysts and Investors: Perfect for evaluating forecasts, confirming strategies, and enhancing efficiency.
Key Features
- Comprehensive DCF Calculator: Features detailed unlevered and levered DCF valuation models tailored for Union Bank of India (UNIONBANKNS).
- WACC Calculator: Pre-designed Weighted Average Cost of Capital sheet with options for customizable inputs.
- Customizable Forecast Assumptions: Adjust growth rates, capital expenditures, and discount rates to suit your analysis.
- Integrated Financial Ratios: Assess profitability, leverage, and efficiency ratios specific to Union Bank of India (UNIONBANKNS).
- Interactive Dashboard and Charts: Visual representations summarize essential valuation metrics for straightforward analysis.
How It Functions
- Download: Obtain the pre-prepared Excel file containing Union Bank of India's financial information.
- Customize: Modify projections, such as revenue increase, EBITDA margin, and WACC.
- Auto-Update: The calculations for intrinsic value and NPV refresh automatically.
- Scenario Testing: Develop various forecasts and instantly compare the results.
- Decision Making: Leverage the valuation findings to inform your investment approach.
Why Opt for UNIONBANKNS Calculator?
- Time-Saving: Skip the hassle of building a DCF model from the ground up – it’s ready to go.
- Enhanced Accuracy: Dependable financial data and formulas minimize valuation errors.
- Completely Customizable: Adjust the model to suit your assumptions and forecasts.
- Simple to Understand: Intuitive charts and outputs facilitate easy analysis of results.
- Endorsed by Industry Experts: Crafted for professionals who prioritize accuracy and efficiency.
Who Can Benefit from UNIONBANKNS?
- Finance Students: Master valuation methods and apply them with real-time data.
- Academics: Integrate industry-standard models into your research or courses.
- Investors: Validate your investment theories and evaluate outcomes related to UNIONBANKNS.
- Analysts: Enhance your efficiency with a customizable and ready-made DCF model.
- Small Business Owners: Discover how major public institutions like UNIONBANKNS are assessed.
Contents of the Template
- Operating and Balance Sheet Data: Pre-filled historical data and forecasts for Union Bank of India (UNIONBANKNS), including metrics such as revenue, EBITDA, EBIT, and capital expenditures.
- WACC Calculation: A dedicated sheet for calculating the Weighted Average Cost of Capital (WACC), featuring key inputs like Beta, risk-free rate, and share price.
- DCF Valuation (Unlevered and Levered): Customizable Discounted Cash Flow models that present intrinsic value along with comprehensive calculations.
- Financial Statements: Pre-loaded annual and quarterly financial statements to aid in your analysis.
- Key Ratios: A collection of important ratios pertaining to profitability, leverage, and efficiency for Union Bank of India (UNIONBANKNS).
- Dashboard and Charts: A visual representation of valuation outputs and assumptions for easier result analysis.
Disclaimer
All information, articles, and product details provided on this website are for general informational and educational purposes only. We do not claim any ownership over, nor do we intend to infringe upon, any trademarks, copyrights, logos, brand names, or other intellectual property mentioned or depicted on this site. Such intellectual property remains the property of its respective owners, and any references here are made solely for identification or informational purposes, without implying any affiliation, endorsement, or partnership.
We make no representations or warranties, express or implied, regarding the accuracy, completeness, or suitability of any content or products presented. Nothing on this website should be construed as legal, tax, investment, financial, medical, or other professional advice. In addition, no part of this site—including articles or product references—constitutes a solicitation, recommendation, endorsement, advertisement, or offer to buy or sell any securities, franchises, or other financial instruments, particularly in jurisdictions where such activity would be unlawful.
All content is of a general nature and may not address the specific circumstances of any individual or entity. It is not a substitute for professional advice or services. Any actions you take based on the information provided here are strictly at your own risk. You accept full responsibility for any decisions or outcomes arising from your use of this website and agree to release us from any liability in connection with your use of, or reliance upon, the content or products found herein.