
|
Valoración DCF de Union Pacific Corporation (UNP) |
Completamente Editable: Adáptelo A Sus Necesidades En Excel O Sheets
Diseño Profesional: Plantillas Confiables Y Estándares De La Industria
Predeterminadas Para Un Uso Rápido Y Eficiente
Compatible con MAC / PC, completamente desbloqueado
No Se Necesita Experiencia; Fáciles De Seguir
Union Pacific Corporation (UNP) Bundle
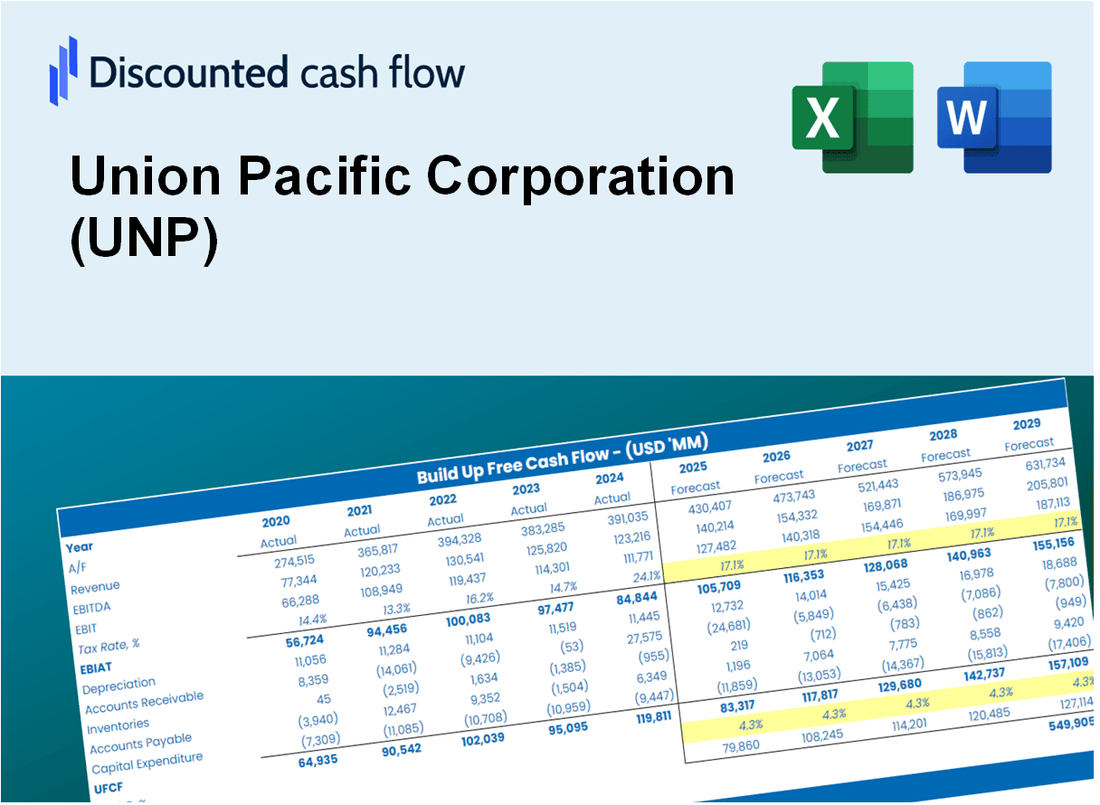
¡Maspere su análisis de valoración de Union Pacific Corporation (UNP) utilizando nuestra sofisticada calculadora DCF! Equipado con datos reales (UNP), esta plantilla de Excel le permite ajustar los pronósticos y supuestos, lo que permite cálculos precisos del valor intrínseco de Union Pacific Corporation.
What You Will Get
- Editable Forecast Inputs: Easily adjust key assumptions (growth %, margins, WACC) to explore various scenarios.
- Real-World Data: Union Pacific Corporation's (UNP) financial data pre-loaded to facilitate your analysis.
- Automatic DCF Outputs: The template computes Net Present Value (NPV) and intrinsic value automatically.
- Customizable and Professional: A refined Excel model that can be tailored to your valuation requirements.
- Built for Analysts and Investors: Perfect for evaluating projections, confirming strategies, and enhancing efficiency.
Key Features
- Real-Life UNP Data: Pre-filled with Union Pacific’s historical financials and future projections.
- Fully Customizable Inputs: Modify revenue growth, margins, WACC, tax rates, and capital expenditures to suit your analysis.
- Dynamic Valuation Model: Automatically updates the Net Present Value (NPV) and intrinsic value based on your adjusted inputs.
- Scenario Testing: Develop various forecast scenarios to evaluate different valuation possibilities.
- User-Friendly Design: Intuitive, structured layout suitable for both professionals and newcomers.
How It Works
- Step 1: Download the Excel file.
- Step 2: Review Union Pacific Corporation’s pre-filled financial data and forecasts.
- Step 3: Modify critical inputs like revenue growth, WACC, and tax rates (highlighted cells).
- Step 4: Watch the DCF model update instantly as you tweak assumptions.
- Step 5: Analyze the outputs and use the results for investment decisions regarding Union Pacific Corporation (UNP).
Why Choose Union Pacific Corporation (UNP)?
- Extensive Network: Benefit from one of the largest rail networks in North America.
- Operational Efficiency: Advanced logistics and technology enhance service reliability.
- Commitment to Sustainability: Focused on reducing environmental impact through innovative practices.
- Strong Financial Performance: Consistent revenue growth and profitability attract investors.
- Industry Expertise: A seasoned team dedicated to delivering value and customer satisfaction.
Who Should Use This Product?
- Investors: Accurately assess Union Pacific Corporation’s (UNP) fair value prior to making investment choices.
- CFOs: Utilize a high-quality DCF model for comprehensive financial reporting and analysis.
- Consultants: Efficiently modify the template for client valuation reports.
- Entrepreneurs: Acquire insights into the financial modeling practices of leading companies.
- Educators: Employ it as a resource to illustrate valuation techniques.
What the Template Contains
- Pre-Filled Data: Includes Union Pacific Corporation’s historical financials and forecasts.
- Discounted Cash Flow Model: Editable DCF valuation model with automatic calculations.
- Weighted Average Cost of Capital (WACC): A dedicated sheet for calculating WACC based on custom inputs.
- Key Financial Ratios: Analyze Union Pacific Corporation’s profitability, efficiency, and leverage.
- Customizable Inputs: Edit revenue growth, margins, and tax rates with ease.
- Clear Dashboard: Charts and tables summarizing key valuation results.
Disclaimer
All information, articles, and product details provided on this website are for general informational and educational purposes only. We do not claim any ownership over, nor do we intend to infringe upon, any trademarks, copyrights, logos, brand names, or other intellectual property mentioned or depicted on this site. Such intellectual property remains the property of its respective owners, and any references here are made solely for identification or informational purposes, without implying any affiliation, endorsement, or partnership.
We make no representations or warranties, express or implied, regarding the accuracy, completeness, or suitability of any content or products presented. Nothing on this website should be construed as legal, tax, investment, financial, medical, or other professional advice. In addition, no part of this site—including articles or product references—constitutes a solicitation, recommendation, endorsement, advertisement, or offer to buy or sell any securities, franchises, or other financial instruments, particularly in jurisdictions where such activity would be unlawful.
All content is of a general nature and may not address the specific circumstances of any individual or entity. It is not a substitute for professional advice or services. Any actions you take based on the information provided here are strictly at your own risk. You accept full responsibility for any decisions or outcomes arising from your use of this website and agree to release us from any liability in connection with your use of, or reliance upon, the content or products found herein.