
|
United Utilitity Group Plc (UU.L) Valoración de DCF |
Completamente Editable: Adáptelo A Sus Necesidades En Excel O Sheets
Diseño Profesional: Plantillas Confiables Y Estándares De La Industria
Predeterminadas Para Un Uso Rápido Y Eficiente
Compatible con MAC / PC, completamente desbloqueado
No Se Necesita Experiencia; Fáciles De Seguir
United Utilities Group PLC (UU.L) Bundle
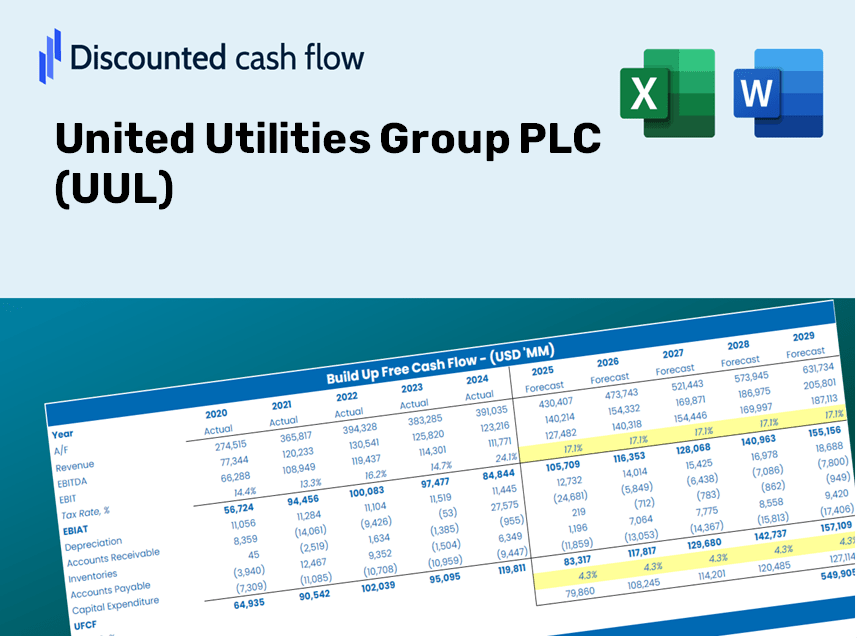
¡Mejore sus opciones de inversión con la calculadora DCF de United Utilitity Group PLC (UUL)! Explore los auténticos datos financieros de United Utilities, ajuste las proyecciones y gastos de crecimiento, y observe instantáneamente cómo las variaciones afectan el valor intrínseco de United Utilities Group PLC (UUL).
Discounted Cash Flow (DCF) - (USD MM)
| Year | AY1 2021 |
AY2 2022 |
AY3 2023 |
AY4 2024 |
AY5 2025 |
FY1 2026 |
FY2 2027 |
FY3 2028 |
FY4 2029 |
FY5 2030 |
|---|---|---|---|---|---|---|---|---|---|---|
| Revenue | 1,808.0 | 1,862.7 | 1,824.4 | 1,949.5 | 2,145.2 | 2,241.0 | 2,341.1 | 2,445.7 | 2,554.9 | 2,669.0 |
| Revenue Growth, % | 0 | 3.03 | -2.06 | 6.86 | 10.04 | 4.47 | 4.47 | 4.47 | 4.47 | 4.47 |
| EBITDA | 1,155.0 | 1,190.6 | 1,177.6 | 992.7 | 1,192.2 | 1,339.4 | 1,399.2 | 1,461.7 | 1,527.0 | 1,595.2 |
| EBITDA, % | 63.88 | 63.92 | 64.55 | 50.92 | 55.58 | 59.77 | 59.77 | 59.77 | 59.77 | 59.77 |
| Depreciation | 422.3 | 418.2 | 423.6 | 438.8 | 464.9 | 507.4 | 530.1 | 553.7 | 578.5 | 604.3 |
| Depreciation, % | 23.36 | 22.45 | 23.22 | 22.51 | 21.67 | 22.64 | 22.64 | 22.64 | 22.64 | 22.64 |
| EBIT | 732.7 | 772.4 | 754.0 | 553.9 | 727.3 | 832.0 | 869.2 | 908.0 | 948.6 | 990.9 |
| EBIT, % | 40.53 | 41.47 | 41.33 | 28.41 | 33.9 | 37.13 | 37.13 | 37.13 | 37.13 | 37.13 |
| Total Cash | 744.1 | 240.9 | 340.4 | 1,399.3 | 1,672.6 | 997.2 | 1,041.8 | 1,088.3 | 1,136.9 | 1,187.7 |
| Total Cash, percent | .0 | .0 | .0 | .0 | .0 | .0 | .0 | .0 | .0 | .0 |
| Account Receivables | 229.2 | 222.7 | 190.5 | 226.8 | 282.0 | 268.3 | 280.2 | 292.8 | 305.8 | 319.5 |
| Account Receivables, % | 12.68 | 11.96 | 10.44 | 11.63 | 13.15 | 11.97 | 11.97 | 11.97 | 11.97 | 11.97 |
| Inventories | 18.3 | 17.8 | 13.1 | 21.5 | 24.6 | 22.1 | 23.1 | 24.1 | 25.2 | 26.3 |
| Inventories, % | 1.01 | 0.9556 | 0.71804 | 1.1 | 1.15 | 0.98708 | 0.98708 | 0.98708 | 0.98708 | 0.98708 |
| Accounts Payable | 14.5 | 28.3 | 26.4 | 23.4 | 29.9 | 28.5 | 29.8 | 31.1 | 32.5 | 34.0 |
| Accounts Payable, % | 0.80199 | 1.52 | 1.45 | 1.2 | 1.39 | 1.27 | 1.27 | 1.27 | 1.27 | 1.27 |
| Capital Expenditure | -644.0 | -628.5 | -694.0 | -764.1 | -998.0 | -865.6 | -904.2 | -944.6 | -986.8 | -1,030.9 |
| Capital Expenditure, % | -35.62 | -33.74 | -38.04 | -39.19 | -46.52 | -38.62 | -38.62 | -38.62 | -38.62 | -38.62 |
| Tax Rate, % | 25.44 | 25.44 | 25.44 | 25.44 | 25.44 | 25.44 | 25.44 | 25.44 | 25.44 | 25.44 |
| EBITAT | 592.9 | -99.3 | 602.8 | 413.5 | 542.3 | 516.0 | 539.0 | 563.1 | 588.3 | 614.5 |
| Depreciation | ||||||||||
| Changes in Account Receivables | ||||||||||
| Changes in Inventories | ||||||||||
| Changes in Accounts Payable | ||||||||||
| Capital Expenditure | ||||||||||
| UFCF | 138.2 | -288.8 | 367.4 | 40.5 | -42.6 | 172.7 | 153.2 | 160.0 | 167.2 | 174.6 |
| WACC, % | 4.37 | 2.64 | 4.35 | 4.24 | 4.23 | 3.97 | 3.97 | 3.97 | 3.97 | 3.97 |
| PV UFCF | ||||||||||
| SUM PV UFCF | 737.0 | |||||||||
| Long Term Growth Rate, % | 2.00 | |||||||||
| Free cash flow (T + 1) | 178 | |||||||||
| Terminal Value | 9,056 | |||||||||
| Present Terminal Value | 7,455 | |||||||||
| Enterprise Value | 8,192 | |||||||||
| Net Debt | 9,112 | |||||||||
| Equity Value | -920 | |||||||||
| Diluted Shares Outstanding, MM | 684 | |||||||||
| Equity Value Per Share | -134.62 |
What You Will Receive
- Flexible Input Parameters: Effortlessly adjust key variables (growth %, margins, WACC) to explore various scenarios.
- Comprehensive Financial Data: United Utilities Group PLC's (UUL) financial information pre-loaded to accelerate your analysis.
- Instant DCF Calculations: The model automatically computes Net Present Value (NPV) and intrinsic value for you.
- Customizable and Professional Design: A refined Excel template that caters to your valuation requirements.
- Designed for Analysts and Investors: Perfect for evaluating forecasts, verifying strategies, and enhancing efficiency.
Key Features
- Pre-Loaded Data: Historical financial statements and pre-filled forecasts for United Utilities Group PLC (UUL).
- Fully Adjustable Inputs: Customize WACC, tax rates, revenue growth, and EBITDA margins to suit your analysis.
- Instant Results: Watch the intrinsic value of United Utilities Group PLC (UUL) update in real time.
- Clear Visual Outputs: Dashboard charts showcase valuation results and essential metrics.
- Built for Accuracy: A sophisticated tool designed for analysts, investors, and finance professionals.
How It Functions
- Download the Template: Gain immediate access to the Excel-based UUL DCF Calculator.
- Input Your Assumptions: Modify the yellow-highlighted cells for growth rates, WACC, margins, and other variables.
- Instant Calculations: The model will automatically refresh UUL’s intrinsic value.
- Test Scenarios: Experiment with different assumptions to assess potential changes in valuation.
- Analyze and Decide: Utilize the results to inform your investment or financial decisions.
Why Opt for This Calculator?
- Precision: Authentic United Utilities Group PLC (UUL) financials guarantee reliable data.
- Versatility: Built to allow users to easily test and adjust inputs as needed.
- Efficiency: Eliminate the need to create a DCF model from the ground up.
- Expert-Level: Crafted with the accuracy and functionality expected by financial executives.
- Intuitive: Simple to navigate, even for those new to financial modeling.
Who Can Benefit from This Product?
- Individual Investors: Make educated choices regarding the purchase or sale of United Utilities Group PLC (UUL) stock.
- Financial Analysts: Enhance valuation workflows with comprehensive financial models tailored for United Utilities Group PLC (UUL).
- Consultants: Provide clients with accurate and timely valuation insights on United Utilities Group PLC (UUL).
- Business Owners: Gain insights into the valuation of large corporations like United Utilities Group PLC (UUL) to inform your strategic planning.
- Finance Students: Master valuation techniques using real-life data and examples centered around United Utilities Group PLC (UUL).
Contents of the Template
- Historical Data: Contains United Utilities Group PLC’s (UUL) previous financial performance and baseline projections.
- DCF and Levered DCF Models: Comprehensive templates for assessing the intrinsic value of United Utilities Group PLC (UUL).
- WACC Sheet: Pre-configured calculations for the Weighted Average Cost of Capital.
- Editable Inputs: Customize essential drivers such as growth rates, EBITDA percentages, and CAPEX assumptions.
- Quarterly and Annual Statements: Detailed breakdown of United Utilities Group PLC’s (UUL) financial statements.
- Interactive Dashboard: Dynamically visualize valuation outcomes and forecasts.
Disclaimer
All information, articles, and product details provided on this website are for general informational and educational purposes only. We do not claim any ownership over, nor do we intend to infringe upon, any trademarks, copyrights, logos, brand names, or other intellectual property mentioned or depicted on this site. Such intellectual property remains the property of its respective owners, and any references here are made solely for identification or informational purposes, without implying any affiliation, endorsement, or partnership.
We make no representations or warranties, express or implied, regarding the accuracy, completeness, or suitability of any content or products presented. Nothing on this website should be construed as legal, tax, investment, financial, medical, or other professional advice. In addition, no part of this site—including articles or product references—constitutes a solicitation, recommendation, endorsement, advertisement, or offer to buy or sell any securities, franchises, or other financial instruments, particularly in jurisdictions where such activity would be unlawful.
All content is of a general nature and may not address the specific circumstances of any individual or entity. It is not a substitute for professional advice or services. Any actions you take based on the information provided here are strictly at your own risk. You accept full responsibility for any decisions or outcomes arising from your use of this website and agree to release us from any liability in connection with your use of, or reliance upon, the content or products found herein.