
|
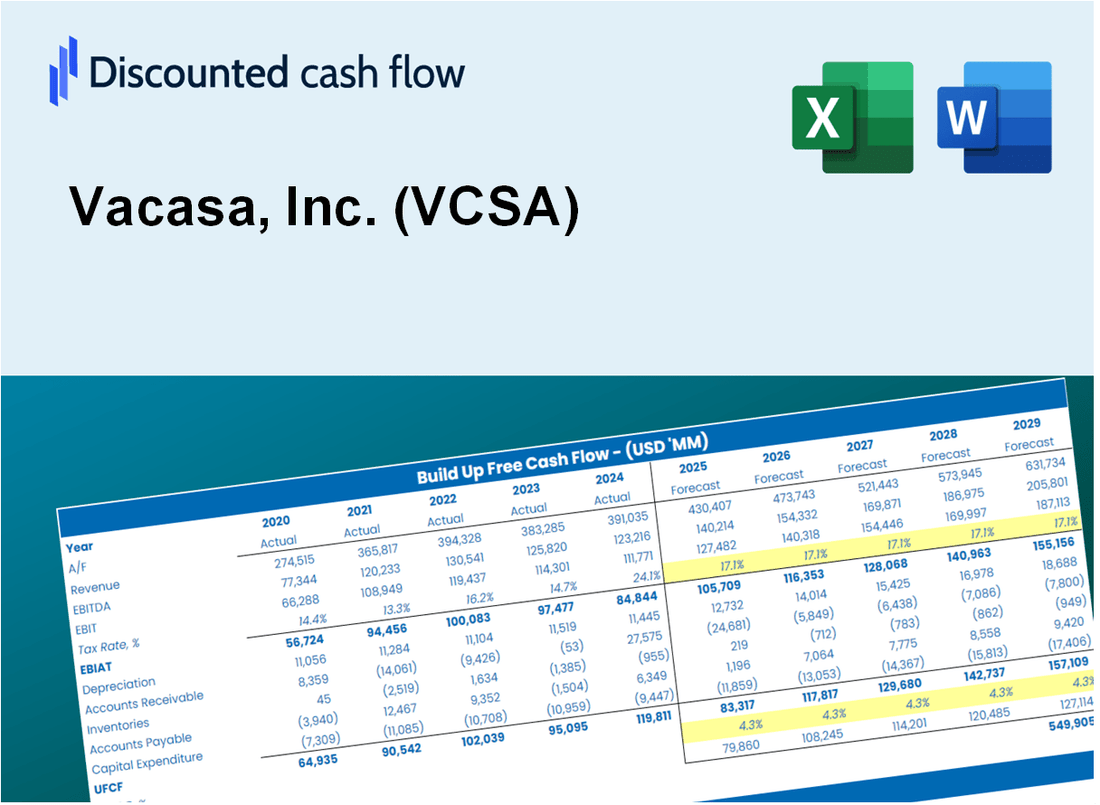
Valoración DCF de Vacasa, Inc. (VCSA) |
Completamente Editable: Adáptelo A Sus Necesidades En Excel O Sheets
Diseño Profesional: Plantillas Confiables Y Estándares De La Industria
Predeterminadas Para Un Uso Rápido Y Eficiente
Compatible con MAC / PC, completamente desbloqueado
No Se Necesita Experiencia; Fáciles De Seguir
Vacasa, Inc. (VCSA) Bundle
¡Explore la perspectiva financiera de Vacasa, Inc. (VCSA) con nuestra calculadora DCF fácil de usar! Ingrese sus suposiciones con respecto al crecimiento, los márgenes y los gastos para determinar el valor intrínseco de Vacasa, Inc. (VCSA) y mejorar su estrategia de inversión.
What You Will Receive
- Pre-Filled Financial Model: Vacasa’s actual data allows for accurate DCF valuation.
- Comprehensive Forecast Control: Modify revenue growth, profit margins, WACC, and other essential drivers.
- Real-Time Calculations: Automatic updates provide immediate feedback as you make adjustments.
- Professional-Grade Template: A polished Excel file crafted for high-quality valuation.
- Customizable and Reusable: Designed for adaptability, enabling repeated use for in-depth forecasts.
Key Features
- Comprehensive Data: Vacasa, Inc.’s historical financial statements and pre-filled forecasts.
- Customizable Inputs: Modify WACC, tax rates, revenue growth, and EBITDA margins as needed.
- Real-Time Results: View Vacasa’s intrinsic value recalculated instantly.
- Visual Performance Metrics: Dashboard charts present valuation results and essential metrics clearly.
- Designed for Precision: A professional-grade tool for analysts, investors, and finance professionals.
How It Works
- Step 1: Download the prebuilt Excel template featuring Vacasa, Inc.'s (VCSA) data.
- Step 2: Navigate through the pre-filled sheets to grasp the essential metrics.
- Step 3: Modify forecasts and assumptions in the editable yellow cells (WACC, growth, margins).
- Step 4: Immediately view recalculated results, including Vacasa, Inc.'s (VCSA) intrinsic value.
- Step 5: Make well-informed investment decisions or create reports using the generated outputs.
Why Choose This Calculator?
- Designed for Industry Experts: A sophisticated tool utilized by property managers, real estate analysts, and investors.
- Comprehensive Data: Vacasa’s historical and projected performance metrics are preloaded for your convenience.
- Flexible Scenario Analysis: Easily model various rental scenarios and market conditions.
- Insightful Outputs: Automatically computes intrinsic value, ROI, and other essential metrics.
- User-Friendly Interface: Step-by-step guidance ensures a smooth navigation experience.
Who Should Use Vacasa, Inc. (VCSA)?
- Property Owners: Optimize rental income with expert management solutions tailored for your property.
- Real Estate Investors: Make informed decisions using data-driven insights and market analysis.
- Vacation Rental Hosts: Streamline operations with customizable tools for bookings and guest communication.
- Travel Enthusiasts: Discover unique vacation experiences through curated rental options.
- Industry Professionals: Enhance your understanding of the vacation rental market with comprehensive resources and case studies.
What the Template Contains
- Operating and Balance Sheet Data: Pre-filled Vacasa, Inc. (VCSA) historical data and forecasts, including revenue, EBITDA, EBIT, and capital expenditures.
- WACC Calculation: A dedicated sheet for Weighted Average Cost of Capital (WACC), including parameters like Beta, risk-free rate, and share price.
- DCF Valuation (Unlevered and Levered): Editable Discounted Cash Flow models showing intrinsic value with detailed calculations.
- Financial Statements: Pre-loaded financial statements (annual and quarterly) to support analysis.
- Key Ratios: Includes profitability, leverage, and efficiency ratios for Vacasa, Inc. (VCSA).
- Dashboard and Charts: Visual summary of valuation outputs and assumptions to analyze results easily.
Disclaimer
All information, articles, and product details provided on this website are for general informational and educational purposes only. We do not claim any ownership over, nor do we intend to infringe upon, any trademarks, copyrights, logos, brand names, or other intellectual property mentioned or depicted on this site. Such intellectual property remains the property of its respective owners, and any references here are made solely for identification or informational purposes, without implying any affiliation, endorsement, or partnership.
We make no representations or warranties, express or implied, regarding the accuracy, completeness, or suitability of any content or products presented. Nothing on this website should be construed as legal, tax, investment, financial, medical, or other professional advice. In addition, no part of this site—including articles or product references—constitutes a solicitation, recommendation, endorsement, advertisement, or offer to buy or sell any securities, franchises, or other financial instruments, particularly in jurisdictions where such activity would be unlawful.
All content is of a general nature and may not address the specific circumstances of any individual or entity. It is not a substitute for professional advice or services. Any actions you take based on the information provided here are strictly at your own risk. You accept full responsibility for any decisions or outcomes arising from your use of this website and agree to release us from any liability in connection with your use of, or reliance upon, the content or products found herein.