
|
Vinfast Auto Ltd. (VFSWW) DCF Valoración |
Completamente Editable: Adáptelo A Sus Necesidades En Excel O Sheets
Diseño Profesional: Plantillas Confiables Y Estándares De La Industria
Predeterminadas Para Un Uso Rápido Y Eficiente
Compatible con MAC / PC, completamente desbloqueado
No Se Necesita Experiencia; Fáciles De Seguir
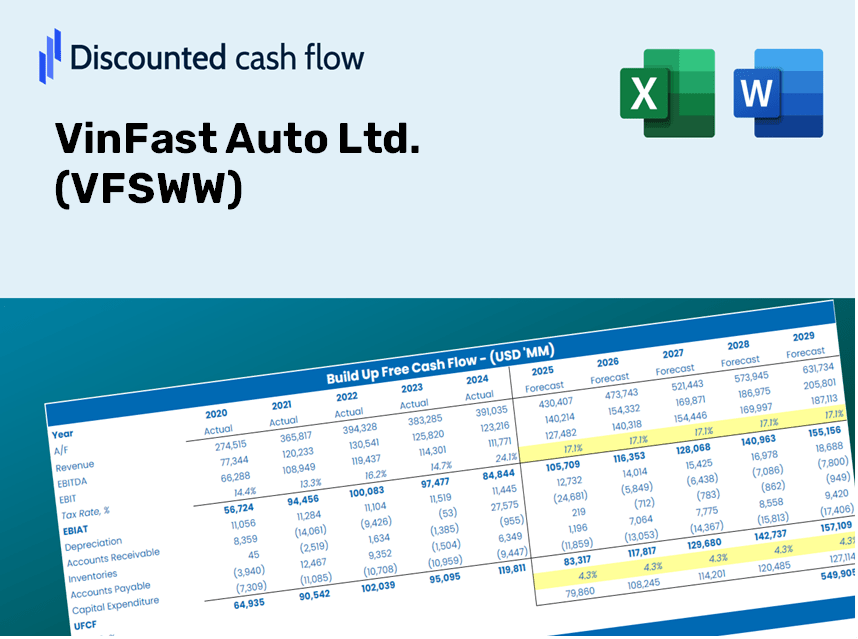
VinFast Auto Ltd. (VFSWW) Bundle
¡Evalúe la perspectiva financiera de Vinfast Auto Ltd. como un experto! Esta calculadora DCF (VFSWW) viene con información financiera precargada y ofrece una flexibilidad total para modificar el crecimiento de los ingresos, WACC, los márgenes y otros supuestos cruciales para alinearse con sus proyecciones.
Discounted Cash Flow (DCF) - (USD MM)
| Year | AY1 2020 |
AY2 2021 |
AY3 2022 |
AY4 2023 |
AY5 2024 |
FY1 2025 |
FY2 2026 |
FY3 2027 |
FY4 2028 |
FY5 2029 |
|---|---|---|---|---|---|---|---|---|---|---|
| Revenue | 522.9 | 612.2 | 571.6 | 1,065.0 | 1,681.3 | 2,331.3 | 3,232.5 | 4,482.2 | 6,214.9 | 8,617.4 |
| Revenue Growth, % | 0 | 17.08 | -6.63 | 86.32 | 57.87 | 38.66 | 38.66 | 38.66 | 38.66 | 38.66 |
| EBITDA | -414.7 | -904.3 | -1,403.8 | -1,606.7 | -1,980.3 | -2,234.9 | -3,098.8 | -4,296.7 | -5,957.8 | -8,260.9 |
| EBITDA, % | -79.32 | -147.72 | -245.58 | -150.86 | -117.78 | -95.86 | -95.86 | -95.86 | -95.86 | -95.86 |
| Depreciation | 164.3 | 186.8 | 239.4 | 241.2 | 377.2 | 694.3 | 962.7 | 1,334.8 | 1,850.8 | 2,566.3 |
| Depreciation, % | 31.43 | 30.52 | 41.87 | 22.65 | 22.44 | 29.78 | 29.78 | 29.78 | 29.78 | 29.78 |
| EBIT | -579.1 | -1,091.2 | -1,643.1 | -1,848.0 | -2,357.6 | -2,331.3 | -3,232.5 | -4,482.2 | -6,214.9 | -8,617.4 |
| EBIT, % | -110.74 | -178.23 | -287.45 | -173.51 | -140.22 | -100 | -100 | -100 | -100 | -100 |
| Total Cash | 31.7 | 115.5 | 163.5 | 156.6 | 157.6 | 361.8 | 501.7 | 695.7 | 964.6 | 1,337.5 |
| Total Cash, percent | .0 | .0 | .0 | .0 | .0 | .0 | .0 | .0 | .0 | .0 |
| Account Receivables | 15.5 | 256.2 | 303.7 | 384.4 | 741.3 | 830.6 | 1,151.6 | 1,596.8 | 2,214.1 | 3,070.1 |
| Account Receivables, % | 2.97 | 41.85 | 53.13 | 36.09 | 44.09 | 35.63 | 35.63 | 35.63 | 35.63 | 35.63 |
| Inventories | 204.4 | 255.3 | 825.3 | 1,151.3 | 1,065.9 | 1,604.8 | 2,225.2 | 3,085.5 | 4,278.2 | 5,932.1 |
| Inventories, % | 39.09 | 41.7 | 144.38 | 108.1 | 63.4 | 68.84 | 68.84 | 68.84 | 68.84 | 68.84 |
| Accounts Payable | 104.4 | 121.8 | 635.5 | 461.4 | 794.1 | 1,074.3 | 1,489.7 | 2,065.5 | 2,864.0 | 3,971.2 |
| Accounts Payable, % | 19.97 | 19.89 | 111.17 | 43.32 | 47.23 | 46.08 | 46.08 | 46.08 | 46.08 | 46.08 |
| Capital Expenditure | -369.4 | -229.5 | -675.4 | -953.1 | -637.5 | -1,564.5 | -2,169.3 | -3,007.9 | -4,170.7 | -5,782.9 |
| Capital Expenditure, % | -70.65 | -37.48 | -118.15 | -89.49 | -37.91 | -67.11 | -67.11 | -67.11 | -67.11 | -67.11 |
| Tax Rate, % | 0.15414 | 0.15414 | 0.15414 | 0.15414 | 0.15414 | 0.15414 | 0.15414 | 0.15414 | 0.15414 | 0.15414 |
| EBITAT | -581.8 | -1,097.1 | -1,672.8 | -1,848.4 | -2,353.9 | -2,330.6 | -3,231.5 | -4,480.8 | -6,213.0 | -8,614.8 |
| Depreciation | ||||||||||
| Changes in Account Receivables | ||||||||||
| Changes in Inventories | ||||||||||
| Changes in Accounts Payable | ||||||||||
| Capital Expenditure | ||||||||||
| UFCF | -902.4 | -1,413.9 | -2,212.6 | -3,141.0 | -2,552.9 | -3,548.8 | -4,964.3 | -6,883.4 | -9,544.4 | -13,234.1 |
| WACC, % | 9.72 | 9.72 | 9.72 | 9.72 | 9.71 | 9.72 | 9.72 | 9.72 | 9.72 | 9.72 |
| PV UFCF | ||||||||||
| SUM PV UFCF | -27,480.9 | |||||||||
| Long Term Growth Rate, % | 2.00 | |||||||||
| Free cash flow (T + 1) | -13,499 | |||||||||
| Terminal Value | -174,934 | |||||||||
| Present Terminal Value | -110,031 | |||||||||
| Enterprise Value | -137,512 | |||||||||
| Net Debt | 5,465 | |||||||||
| Equity Value | -142,977 | |||||||||
| Diluted Shares Outstanding, MM | 2,338 | |||||||||
| Equity Value Per Share | -61.14 |
Benefits You Will Receive
- Customizable Forecast Assumptions: Effortlessly adjust parameters (growth %, profit margins, WACC) to create various scenarios.
- Real-Time Financial Data: VinFast Auto Ltd.'s financial information pre-loaded to expedite your analysis.
- Automated DCF Calculations: The model computes Net Present Value (NPV) and intrinsic value automatically for you.
- Professional and Adaptable: A refined Excel model that can be tailored to suit your valuation requirements.
- Designed for Analysts and Investors: Perfect for evaluating forecasts, confirming strategies, and enhancing efficiency.
Key Features
- Comprehensive DCF Calculator: Features thorough unlevered and levered DCF valuation models tailored for VinFast Auto Ltd. (VFSWW).
- WACC Calculator: An integrated Weighted Average Cost of Capital tool with flexible input options.
- Customizable Forecast Assumptions: Adjust growth projections, capital expenditures, and discount rates as needed.
- Integrated Financial Ratios: Evaluate profitability, leverage, and efficiency ratios specific to VinFast Auto Ltd. (VFSWW).
- Interactive Dashboard and Charts: Visual representations of key valuation metrics facilitate straightforward analysis.
How It Works
- Download: Obtain the pre-built Excel file containing VinFast Auto Ltd.'s (VFSWW) financial data.
- Customize: Modify projections, including revenue growth, EBITDA %, and WACC as per your analysis needs.
- Update Automatically: Watch as the intrinsic value and NPV calculations refresh in real-time.
- Test Scenarios: Generate various projections and instantly compare the results.
- Make Decisions: Leverage the valuation findings to inform your investment strategy.
Why Choose This Calculator for VinFast Auto Ltd. (VFSWW)?
- All-Inclusive Solution: Combines DCF, WACC, and financial ratio analyses in a single platform.
- Flexible Customization: Modify the yellow-highlighted fields to explore different scenarios.
- In-Depth Analysis: Automatically calculates VinFast's intrinsic value and Net Present Value.
- Preloaded Information: Historical and projected data provide a solid foundation for accurate assessments.
- High-Quality Standards: Perfect for financial analysts, investors, and business advisors.
Who Should Use This Product?
- Finance Students: Master valuation methods and apply them using real-time data relevant to VinFast Auto Ltd. (VFSWW).
- Academics: Integrate industry-standard models into your academic work or research projects.
- Investors: Validate your investment strategies and analyze valuation scenarios for VinFast Auto Ltd. (VFSWW).
- Analysts: Enhance your analysis process with a customizable, pre-built DCF model tailored for VinFast Auto Ltd. (VFSWW).
- Small Business Owners: Discover how large public companies like VinFast Auto Ltd. (VFSWW) are evaluated in the market.
Contents of the Template
- Detailed DCF Model: An editable framework featuring thorough valuation computations.
- Real-World Data: Historical and projected financial figures for VinFast Auto Ltd. (VFSWW) preloaded for your analysis.
- Customizable Parameters: Modify WACC, growth rates, and tax assumptions to explore various scenarios.
- Financial Statements: Comprehensive annual and quarterly reports for enhanced insights.
- Key Ratios: Integrated analysis covering profitability, efficiency, and leverage metrics.
- Dashboard with Visual Outputs: Graphs and tables designed for clear, actionable insights.
Disclaimer
All information, articles, and product details provided on this website are for general informational and educational purposes only. We do not claim any ownership over, nor do we intend to infringe upon, any trademarks, copyrights, logos, brand names, or other intellectual property mentioned or depicted on this site. Such intellectual property remains the property of its respective owners, and any references here are made solely for identification or informational purposes, without implying any affiliation, endorsement, or partnership.
We make no representations or warranties, express or implied, regarding the accuracy, completeness, or suitability of any content or products presented. Nothing on this website should be construed as legal, tax, investment, financial, medical, or other professional advice. In addition, no part of this site—including articles or product references—constitutes a solicitation, recommendation, endorsement, advertisement, or offer to buy or sell any securities, franchises, or other financial instruments, particularly in jurisdictions where such activity would be unlawful.
All content is of a general nature and may not address the specific circumstances of any individual or entity. It is not a substitute for professional advice or services. Any actions you take based on the information provided here are strictly at your own risk. You accept full responsibility for any decisions or outcomes arising from your use of this website and agree to release us from any liability in connection with your use of, or reliance upon, the content or products found herein.