
|
Valoración DCF de Veris Residential, Inc. (VRE) |
Completamente Editable: Adáptelo A Sus Necesidades En Excel O Sheets
Diseño Profesional: Plantillas Confiables Y Estándares De La Industria
Predeterminadas Para Un Uso Rápido Y Eficiente
Compatible con MAC / PC, completamente desbloqueado
No Se Necesita Experiencia; Fáciles De Seguir
Veris Residential, Inc. (VRE) Bundle
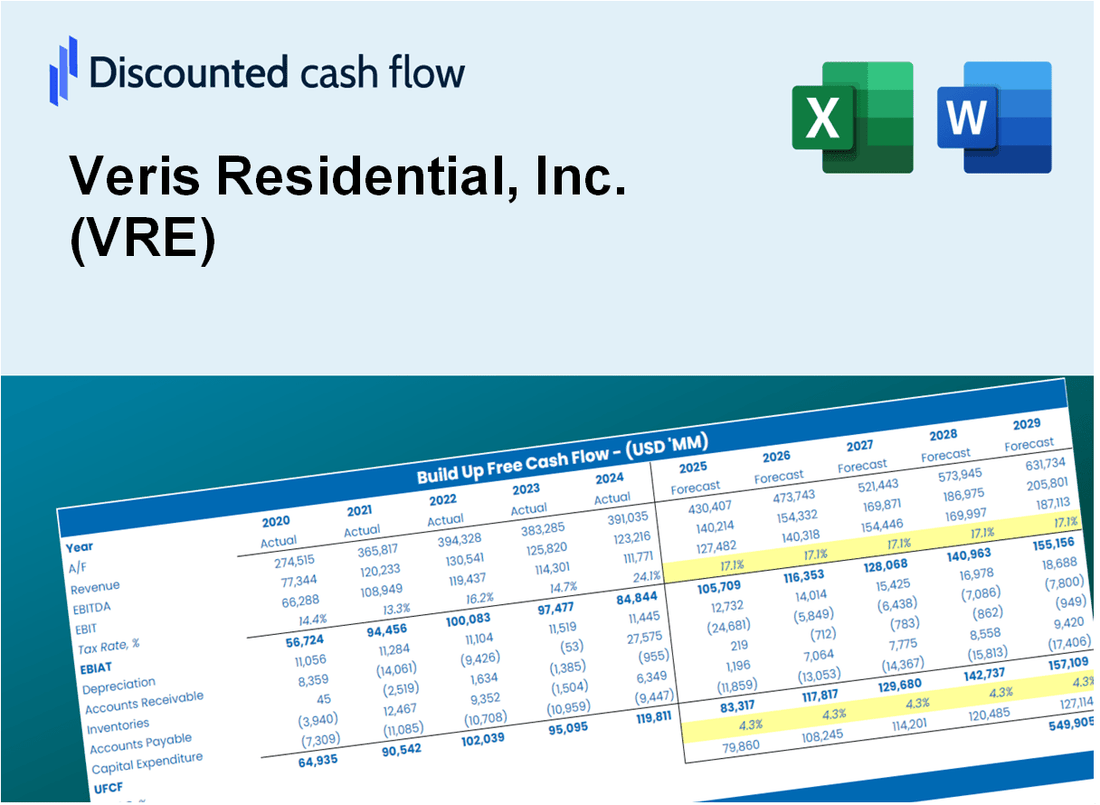
Diseñada para la precisión, nuestra calculadora DCF (VRE) le permite evaluar la valoración de Veris Residential, Inc. utilizando datos financieros reales y una flexibilidad completa para modificar todos los parámetros clave para obtener pronósticos mejorados.
What You Will Get
- Real Veris Residential Data: Preloaded financials – from revenue to EBIT – based on actual and projected figures.
- Full Customization: Adjust all critical parameters (yellow cells) like WACC, growth %, and tax rates.
- Instant Valuation Updates: Automatic recalculations to analyze the impact of changes on Veris Residential's fair value.
- Versatile Excel Template: Tailored for quick edits, scenario testing, and detailed projections.
- Time-Saving and Accurate: Skip building models from scratch while maintaining precision and flexibility.
Key Features
- Accurate Financial Data for Veris Residential: Gain access to reliable historical data and future projections tailored for Veris Residential, Inc. (VRE).
- Flexible Forecast Assumptions: Customize key variables such as WACC, growth rates, and margins in highlighted cells.
- Real-Time Calculations: Enjoy automatic updates for DCF, Net Present Value (NPV), and cash flow analyses.
- Interactive Dashboard: Utilize clear charts and summaries to effectively visualize your valuation outcomes.
- Designed for All Skill Levels: A user-friendly layout suitable for investors, CFOs, and consultants alike.
How It Works
- 1. Download the Template: Obtain and open the Excel file featuring Veris Residential, Inc. (VRE) preloaded data.
- 2. Adjust Key Inputs: Modify essential variables such as growth rates, WACC, and capital expenditures.
- 3. Analyze Results Immediately: The DCF model automatically computes intrinsic value and NPV in real-time.
- 4. Explore Different Scenarios: Evaluate various forecasts to understand a range of valuation results.
- 5. Present with Assurance: Share professional valuation findings to back your strategic decisions.
Why Choose Veris Residential, Inc. (VRE)?
- Save Time: Instant access to comprehensive real estate data without the hassle of manual research.
- Enhance Accuracy: Dependable market insights and analytics minimize inaccuracies in investment decisions.
- Fully Customizable: Adjust parameters to align with your investment strategies and market expectations.
- User-Friendly Interface: Intuitive dashboards and visualizations simplify data interpretation.
- Endorsed by Industry Leaders: Crafted for real estate professionals who prioritize efficiency and precision.
Who Should Use Veris Residential, Inc. (VRE)?
- Real Estate Investors: Gain insights and make informed decisions with comprehensive property analysis tools.
- Market Analysts: Streamline your research process with ready-to-use data and customizable reports.
- Real Estate Consultants: Effortlessly tailor presentations and reports for your clients using our adaptable templates.
- Property Enthusiasts: Enhance your knowledge of real estate investment strategies through practical examples.
- Educators and Students: Utilize our resources as a hands-on learning aid in real estate and finance courses.
What the Template Contains
- Comprehensive DCF Model: Editable template featuring detailed valuation calculations tailored for Veris Residential, Inc. (VRE).
- Real-World Data: Veris Residential's historical and projected financials preloaded for in-depth analysis.
- Customizable Parameters: Adjust WACC, growth rates, and tax assumptions to explore various scenarios.
- Financial Statements: Complete annual and quarterly breakdowns for enhanced insights into the company's performance.
- Key Ratios: Integrated analysis for assessing profitability, efficiency, and leverage specific to Veris Residential, Inc. (VRE).
- Dashboard with Visual Outputs: Interactive charts and tables providing clear, actionable results for stakeholders.
Disclaimer
All information, articles, and product details provided on this website are for general informational and educational purposes only. We do not claim any ownership over, nor do we intend to infringe upon, any trademarks, copyrights, logos, brand names, or other intellectual property mentioned or depicted on this site. Such intellectual property remains the property of its respective owners, and any references here are made solely for identification or informational purposes, without implying any affiliation, endorsement, or partnership.
We make no representations or warranties, express or implied, regarding the accuracy, completeness, or suitability of any content or products presented. Nothing on this website should be construed as legal, tax, investment, financial, medical, or other professional advice. In addition, no part of this site—including articles or product references—constitutes a solicitation, recommendation, endorsement, advertisement, or offer to buy or sell any securities, franchises, or other financial instruments, particularly in jurisdictions where such activity would be unlawful.
All content is of a general nature and may not address the specific circumstances of any individual or entity. It is not a substitute for professional advice or services. Any actions you take based on the information provided here are strictly at your own risk. You accept full responsibility for any decisions or outcomes arising from your use of this website and agree to release us from any liability in connection with your use of, or reliance upon, the content or products found herein.