
|
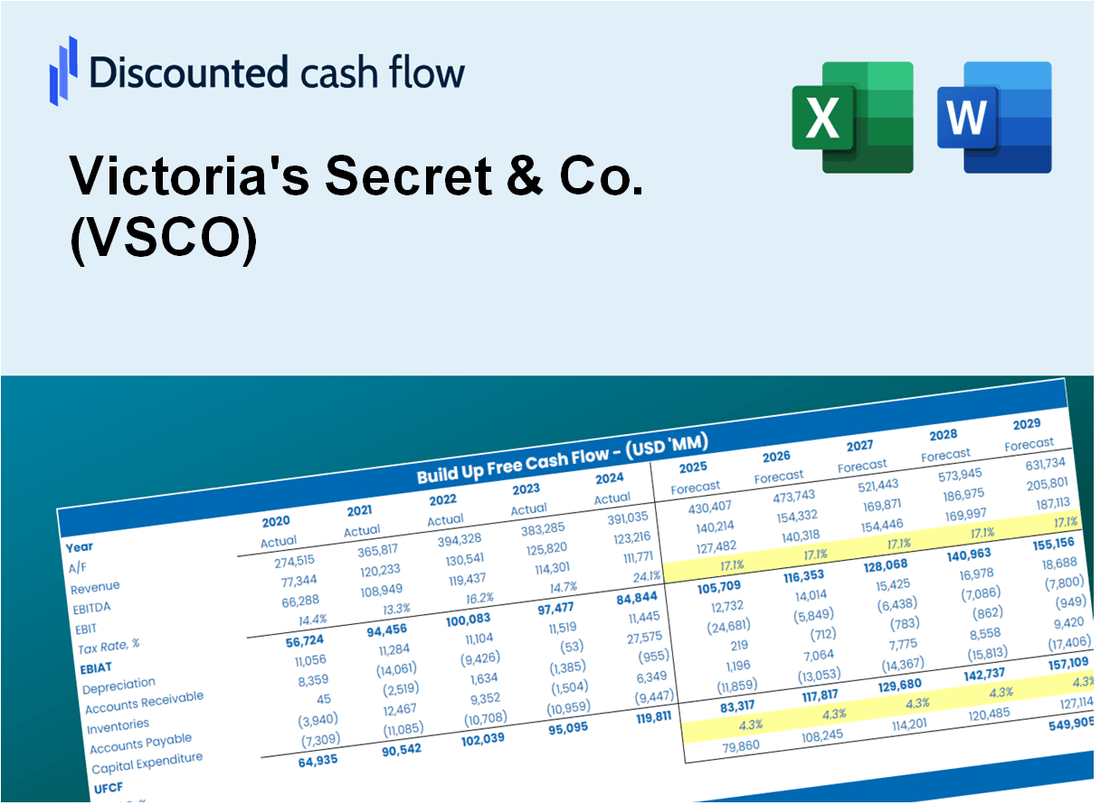
Valoración DCF de Victoria's Secret & Co. (VSCO) |
Completamente Editable: Adáptelo A Sus Necesidades En Excel O Sheets
Diseño Profesional: Plantillas Confiables Y Estándares De La Industria
Predeterminadas Para Un Uso Rápido Y Eficiente
Compatible con MAC / PC, completamente desbloqueado
No Se Necesita Experiencia; Fáciles De Seguir
Victoria's Secret & Co. (VSCO) Bundle
Obtener información sobre Victoria's Secret & ¡Análisis de valoración de Co. (VSCO) utilizando nuestra calculadora DCF de última generación! Esta plantilla de Excel viene precisa con datos precisos (VSCO), lo que le permite ajustar los pronósticos y supuestos para determinar Victoria's Secret & Valor intrínseco de Co. con gran precisión.
What You Will Get
- Real Victoria's Secret Data: Preloaded financials – from revenue to EBIT – based on actual and projected figures for VSCO.
- Full Customization: Adjust all critical parameters (yellow cells) like WACC, growth %, and tax rates specific to VSCO.
- Instant Valuation Updates: Automatic recalculations to analyze the impact of changes on Victoria's Secret’s fair value.
- Versatile Excel Template: Tailored for quick edits, scenario testing, and detailed projections for VSCO.
- Time-Saving and Accurate: Skip building models from scratch while maintaining precision and flexibility for Victoria's Secret.
Key Features
- Comprehensive Historical Data: Victoria's Secret & Co. (VSCO) offers detailed historical financial statements and pre-filled projections.
- Customizable Parameters: Modify WACC, tax rates, revenue growth, and EBITDA margins to suit your analysis.
- Real-Time Insights: Observe the intrinsic value of Victoria's Secret & Co. (VSCO) update instantly.
- Intuitive Visualizations: Engaging dashboard charts present valuation outcomes and essential metrics.
- Engineered for Precision: A robust tool designed for analysts, investors, and finance professionals.
How It Works
- Step 1: Download the prebuilt Excel template containing Victoria's Secret & Co. (VSCO) data.
- Step 2: Navigate through the pre-filled sheets to familiarize yourself with the essential metrics.
- Step 3: Modify forecasts and assumptions in the editable yellow cells (WACC, growth, margins).
- Step 4: Instantly see the recalculated results, including Victoria's Secret & Co.'s intrinsic value.
- Step 5: Utilize the outputs to make informed investment decisions or create reports.
Why Choose This Calculator?
- User-Friendly Interface: Tailored for both novices and seasoned users.
- Customizable Inputs: Adjust parameters to suit your specific analysis needs.
- Real-Time Adjustments: Watch live updates to Victoria's Secret & Co.’s (VSCO) valuation as you change inputs.
- Pre-Loaded Data: Comes with Victoria's Secret & Co.’s (VSCO) actual financial metrics for immediate use.
- Preferred by Experts: Utilized by investors and analysts for making well-informed choices.
Who Should Use This Product?
- Individual Investors: Gain insights to make informed decisions about buying or selling Victoria's Secret & Co. (VSCO) stock.
- Financial Analysts: Enhance valuation processes with comprehensive financial models tailored for Victoria's Secret & Co. (VSCO).
- Consultants: Provide clients with accurate and timely valuation insights related to Victoria's Secret & Co. (VSCO).
- Business Owners: Learn how major retail brands like Victoria's Secret & Co. (VSCO) are valued to inform your own business strategies.
- Finance Students: Explore valuation techniques using real-world data and case studies centered around Victoria's Secret & Co. (VSCO).
What the Template Contains
- Preloaded VSCO Data: Historical and projected financial data, including revenue, EBIT, and capital expenditures.
- DCF and WACC Models: Professional-grade sheets for calculating intrinsic value and Weighted Average Cost of Capital.
- Editable Inputs: Yellow-highlighted cells for adjusting revenue growth, tax rates, and discount rates.
- Financial Statements: Comprehensive annual and quarterly financials for deeper analysis.
- Key Ratios: Profitability, leverage, and efficiency ratios to evaluate performance.
- Dashboard and Charts: Visual summaries of valuation outcomes and assumptions.
Disclaimer
All information, articles, and product details provided on this website are for general informational and educational purposes only. We do not claim any ownership over, nor do we intend to infringe upon, any trademarks, copyrights, logos, brand names, or other intellectual property mentioned or depicted on this site. Such intellectual property remains the property of its respective owners, and any references here are made solely for identification or informational purposes, without implying any affiliation, endorsement, or partnership.
We make no representations or warranties, express or implied, regarding the accuracy, completeness, or suitability of any content or products presented. Nothing on this website should be construed as legal, tax, investment, financial, medical, or other professional advice. In addition, no part of this site—including articles or product references—constitutes a solicitation, recommendation, endorsement, advertisement, or offer to buy or sell any securities, franchises, or other financial instruments, particularly in jurisdictions where such activity would be unlawful.
All content is of a general nature and may not address the specific circumstances of any individual or entity. It is not a substitute for professional advice or services. Any actions you take based on the information provided here are strictly at your own risk. You accept full responsibility for any decisions or outcomes arising from your use of this website and agree to release us from any liability in connection with your use of, or reliance upon, the content or products found herein.