
|
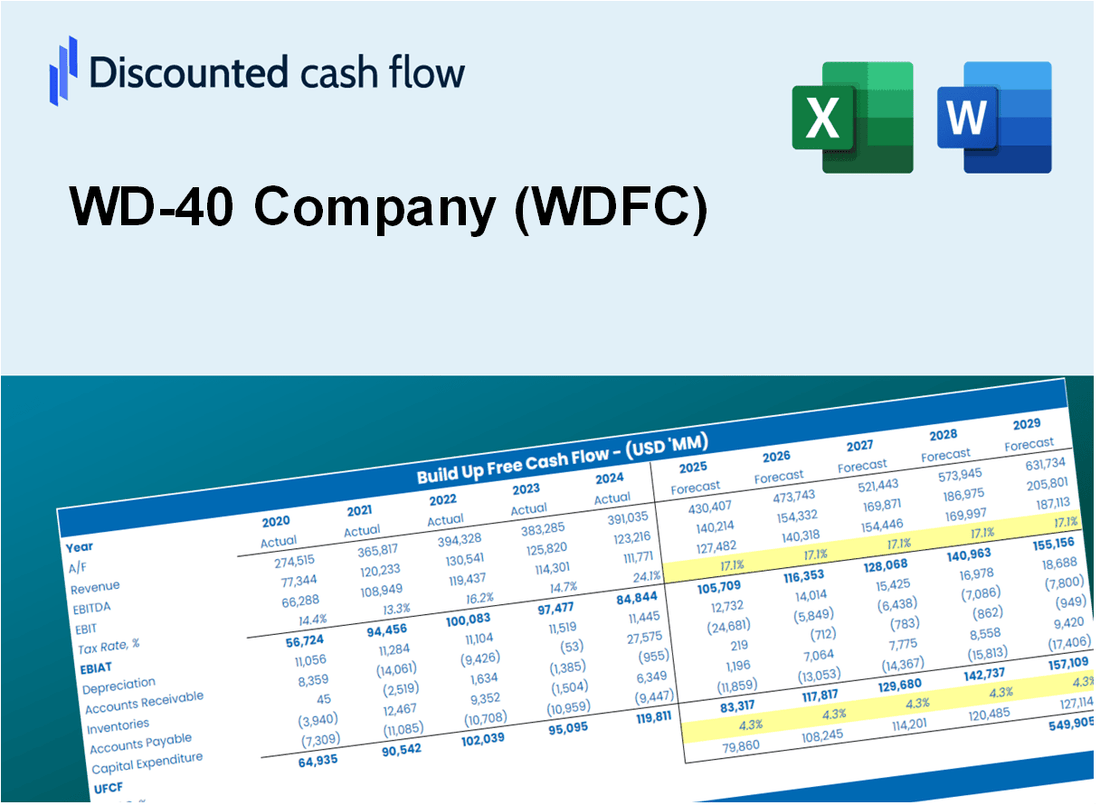
Valoración DCF de WD-40 Company (WDFC) |
Completamente Editable: Adáptelo A Sus Necesidades En Excel O Sheets
Diseño Profesional: Plantillas Confiables Y Estándares De La Industria
Predeterminadas Para Un Uso Rápido Y Eficiente
Compatible con MAC / PC, completamente desbloqueado
No Se Necesita Experiencia; Fáciles De Seguir
WD-40 Company (WDFC) Bundle
¡Evalúe las perspectivas financieras de la empresa WD-40 como un experto! Esta calculadora DCF (WDFC) proporciona datos financieros preconsados junto con la flexibilidad para modificar el crecimiento de los ingresos, WACC, los márgenes y otros supuestos esenciales para alinearse con sus proyecciones.
What You Will Get
- Authentic WD-40 Data: Preloaded financials – encompassing revenue to EBIT – based on actual and projected figures for WD-40 Company (WDFC).
- Comprehensive Customization: Modify all essential parameters (yellow cells) such as WACC, growth %, and tax rates.
- Immediate Valuation Adjustments: Automatic recalculations to assess the effects of changes on WD-40’s fair value.
- Flexible Excel Template: Designed for quick modifications, scenario analysis, and thorough projections.
- Efficient and Precise: Avoid constructing models from scratch while ensuring accuracy and adaptability.
Key Features
- Comprehensive Data: WD-40 Company's historical financial statements and pre-filled projections.
- Customizable Inputs: Adjust WACC, tax rates, revenue growth, and EBITDA margins as needed.
- Real-Time Calculations: View WD-40's intrinsic value update instantly.
- Intuitive Visual Outputs: Dashboard graphs illustrate valuation results and essential metrics.
- Designed for Precision: A professional-grade tool for analysts, investors, and finance professionals.
How It Works
- Step 1: Download the prebuilt Excel template featuring WD-40 Company’s (WDFC) financial data.
- Step 2: Navigate through the pre-filled sheets to familiarize yourself with the essential metrics.
- Step 3: Modify forecasts and assumptions in the editable yellow cells (WACC, growth, margins).
- Step 4: Instantly see the updated results, including WD-40 Company’s (WDFC) intrinsic value.
- Step 5: Utilize the outputs to make informed investment choices or create detailed reports.
Why Choose This Calculator?
- User-Friendly Interface: Perfectly crafted for both novices and seasoned professionals.
- Customizable Inputs: Adjust parameters to suit your specific analysis needs.
- Real-Time Feedback: Instantly observe changes to WD-40 Company’s valuation with every input adjustment.
- Pre-Loaded Data: Comes with WD-40 Company’s actual financial figures for rapid analysis.
- Relied Upon by Experts: Employed by investors and analysts for well-informed decision-making.
Who Should Use This Product?
- Professional Investors: Develop comprehensive and accurate valuation models for assessing WD-40 Company (WDFC).
- Corporate Finance Teams: Evaluate valuation scenarios to inform strategic decisions within the organization.
- Consultants and Advisors: Deliver precise valuation insights for clients interested in WD-40 Company (WDFC).
- Students and Educators: Utilize real-world data to practice and teach financial modeling techniques related to WD-40 Company (WDFC).
- DIY Enthusiasts: Gain insights into how companies like WD-40 Company (WDFC) are valued in the marketplace.
What the Template Contains
- Preloaded WDFC Data: Historical and projected financial data, including revenue, EBIT, and capital expenditures.
- DCF and WACC Models: Professional-grade sheets for calculating intrinsic value and Weighted Average Cost of Capital.
- Editable Inputs: Yellow-highlighted cells for adjusting revenue growth, tax rates, and discount rates.
- Financial Statements: Comprehensive annual and quarterly financials for deeper analysis.
- Key Ratios: Profitability, leverage, and efficiency ratios to evaluate performance.
- Dashboard and Charts: Visual summaries of valuation outcomes and assumptions.
Disclaimer
All information, articles, and product details provided on this website are for general informational and educational purposes only. We do not claim any ownership over, nor do we intend to infringe upon, any trademarks, copyrights, logos, brand names, or other intellectual property mentioned or depicted on this site. Such intellectual property remains the property of its respective owners, and any references here are made solely for identification or informational purposes, without implying any affiliation, endorsement, or partnership.
We make no representations or warranties, express or implied, regarding the accuracy, completeness, or suitability of any content or products presented. Nothing on this website should be construed as legal, tax, investment, financial, medical, or other professional advice. In addition, no part of this site—including articles or product references—constitutes a solicitation, recommendation, endorsement, advertisement, or offer to buy or sell any securities, franchises, or other financial instruments, particularly in jurisdictions where such activity would be unlawful.
All content is of a general nature and may not address the specific circumstances of any individual or entity. It is not a substitute for professional advice or services. Any actions you take based on the information provided here are strictly at your own risk. You accept full responsibility for any decisions or outcomes arising from your use of this website and agree to release us from any liability in connection with your use of, or reliance upon, the content or products found herein.