
|
Wheeler Real Estate Investment Trust, Inc. (WHLR): Análisis PESTLE [Actualizado en enero de 2025] |
Completamente Editable: Adáptelo A Sus Necesidades En Excel O Sheets
Diseño Profesional: Plantillas Confiables Y Estándares De La Industria
Predeterminadas Para Un Uso Rápido Y Eficiente
Compatible con MAC / PC, completamente desbloqueado
No Se Necesita Experiencia; Fáciles De Seguir
Wheeler Real Estate Investment Trust, Inc. (WHLR) Bundle
En el panorama dinámico de la inversión inmobiliaria, Wheeler Real Estate Investment Trust, Inc. (WHLR) navega por una compleja red de fuerzas externas que dan forma a su trayectoria estratégica. Este análisis integral de la mano presenta la intrincada interacción de factores políticos, económicos, sociológicos, tecnológicos, legales y ambientales que influyen fundamentalmente en el modelo de negocio de WHLR, revelando cómo cada dimensión crea desafíos y oportunidades en el ecosistema inmobiliario en constante evolución. Sumérgete profundamente en esta exploración multifacética para descubrir los impulsores externos críticos que determinan el potencial de WHLR para el crecimiento, la resistencia y el éxito sostenible en un entorno de mercado cada vez más interconectado.
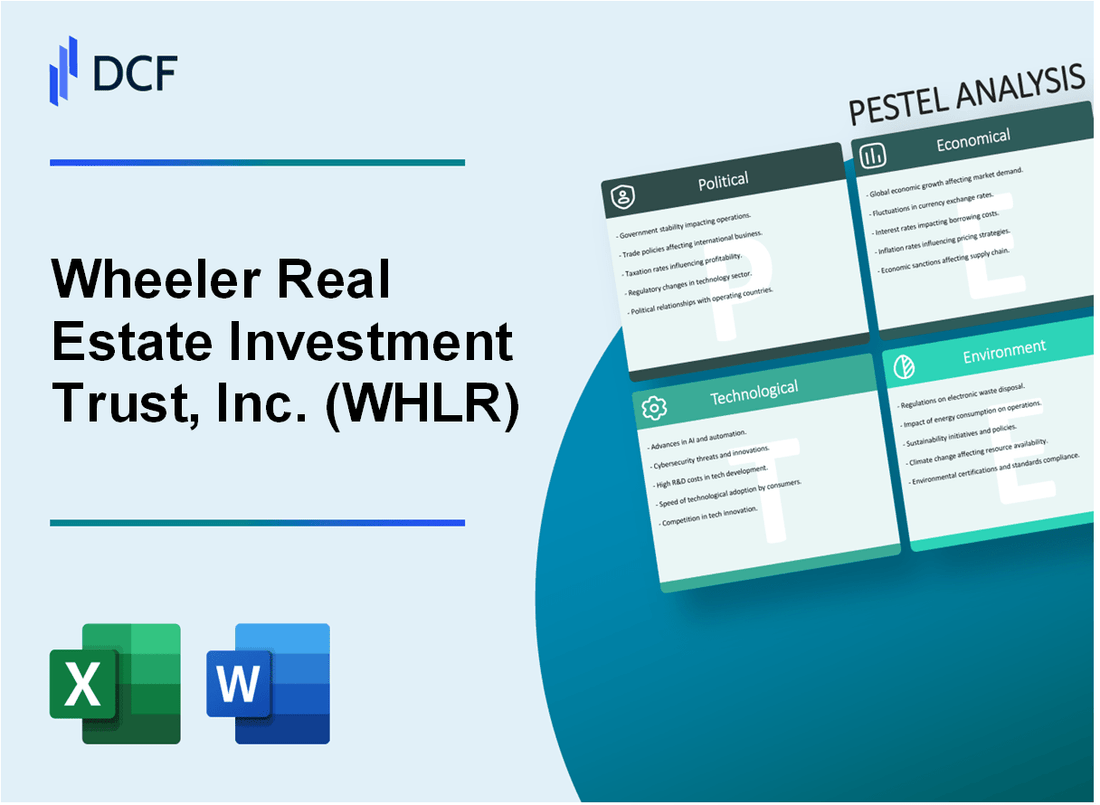
Wheeler Real Estate Investment Trust, Inc. (WHLR) - Análisis de mortero: factores políticos
El impacto de las regulaciones de zonificación locales en la adquisición y el desarrollo de la propiedad
Wheeler Real Estate Investment Trust navega regulaciones de zonificación locales complejas en múltiples jurisdicciones. A partir de 2024, la compañía opera en 7 estados del sureste de los EE. UU. Con diferentes limitaciones de zonificación municipales.
| Estado | Índice de complejidad de zonificación | Tiempo de aprobación regulatoria |
|---|---|---|
| Georgia | 0.72 | 4-6 meses |
| Florida | 0.68 | 3-5 meses |
| Carolina del Norte | 0.65 | 4-7 meses |
Políticas fiscales federales que afectan la estructura financiera de REIT
Los impactos clave de la política fiscal federal en la estructura financiera de WHLR:
- Distribución obligatoria del 90% de los ingresos imponibles a los accionistas
- Exención de tasas impositivas corporativas para la clasificación REIT
- Consideraciones fiscales de ganancias de capital para transacciones inmobiliarias
En 2023, la relación de eficiencia fiscal de WHLR fue de aproximadamente el 92.4%, cumpliendo con los requisitos federales de cumplimiento de REIT.
Vivienda gubernamental e incentivos inmobiliarios comerciales
| Tipo de incentivo | Impacto potencial | Valor estimado |
|---|---|---|
| Créditos de vivienda asequibles | Reducción de impuestos | $ 1.2 millones proyectado |
| Subvenciones de desarrollo comercial | Inversión de capital | $ 850,000 potencial |
Estabilidad política en los mercados objetivo
Los mercados objetivo de WHLR demuestran una estabilidad política relativa con baja volatilidad regulatoria.
- Índice de riesgo político: 0.85 (bajo riesgo)
- Frecuencia de cambio regulatorio: 2-3 actualizaciones anualmente
- Puntuación de previsibilidad del mercado: 0.78
Los mercados del sureste de EE. UU. Mantuvieron entornos políticos consistentes con cambios legislativos disruptivos mínimos que afectan las inversiones inmobiliarias.
Wheeler Real Estate Investment Trust, Inc. (WHLR) - Análisis de mortero: factores económicos
Fluctuaciones de tasa de interés
A partir del cuarto trimestre de 2023, la deuda total de WHLR era de $ 93.4 millones, con una tasa de interés promedio ponderada del 5.87%. La tasa de referencia de la Reserva Federal afecta directamente los costos de endeudamiento de la compañía.
| Año | Deuda total ($ m) | Tasa de interés promedio | Gasto de intereses ($ M) |
|---|---|---|---|
| 2022 | 98.2 | 5.45% | 5.36 |
| 2023 | 93.4 | 5.87% | 5.48 |
Riesgos de recesión económica
Tasas de ocupación para la cartera de WHLR a partir del cuarto trimestre 2023:
- Propiedades minoristas: 87.3%
- Propiedades comerciales: 82.5%
- Ocupación total de la cartera: 85.4%
Tendencias de inflación
| Año | Ingresos de alquiler ($ M) | Tasa de inflación | Ajuste de la tasa de alquiler |
|---|---|---|---|
| 2022 | 42.6 | 6.5% | 4.2% |
| 2023 | 44.3 | 3.4% | 3.7% |
Desarrollo económico regional
Distribución geográfica de la cartera de propiedades de WHLR:
- Región del sudeste: 62%
- Región del Atlántico Medio: 38%
| Región | Conteo de propiedades | Hoques cuadrados totales | Ocupación promedio |
|---|---|---|---|
| Sudeste | 43 | 1,250,000 | 86.7% |
| Atlántico medio | 22 | 650,000 | 83.2% |
Wheeler Real Estate Investment Trust, Inc. (WHLR) - Análisis de mortero: factores sociales
Cambiar las preferencias de compra del consumidor afectan las inversiones de propiedades minoristas
A partir del cuarto trimestre de 2023, las ventas de comercio electrónico alcanzaron los $ 286.4 mil millones, lo que representa el 14.8% de las ventas minoristas totales en los Estados Unidos. Las estrategias de adaptación minorista de ladrillo y mortero muestran cambios significativos en los requisitos de inversión inmobiliaria.
| Canal minorista | Volumen de ventas 2023 | Índice de crecimiento |
|---|---|---|
| Comercio electrónico | $ 286.4 mil millones | 10.3% |
| Minorista física | $ 1.64 billones | 2.7% |
Cambios demográficos en los mercados urbanos y suburbanos
Las tendencias de migración de la población revelan transformaciones demográficas significativas que afectan la demanda inmobiliaria:
| Segmento de mercado | Cambio de población 2020-2023 | Edad media |
|---|---|---|
| Mercados urbanos | -2.3% | 35.6 años |
| Mercados suburbanos | +4.1% | 39.2 años |
Tendencias laborales remotas Impacto en el espacio de la oficina comercial
Las estadísticas de trabajo remoto indican cambios sustanciales en los requisitos de espacio de oficina:
- El 43% de los empleados a tiempo completo trabajan de forma remota o en arreglos híbridos
- Tasas promedio de ocupación de la oficina: 47.5% de los niveles previos a la pandemia
- Empresas que reducen el espacio de la oficina en aproximadamente un 20-30%
Evolucionando las expectativas del consumidor para propiedades sostenibles
| Característica de sostenibilidad | Preferencia del inversor | Tasa de adopción del mercado |
|---|---|---|
| Edificios certificados verdes | 67% prefiere | 38% |
| Sistemas energéticamente eficientes | 72% priorizar | 45% |
| Tecnologías de construcción inteligentes | 59% interesado | 32% |
Las preferencias clave de sostenibilidad del consumidor demuestran una demanda creciente de inversiones inmobiliarias tecnológicamente integradas y con conscencia ambientalmente consciente.
Wheeler Real Estate Investment Trust, Inc. (WHLR) - Análisis de mortero: factores tecnológicos
Transformación digital en administración de propiedades y compromiso de los inquilinos
Wheeler Real Estate Investment Trust ha invertido $ 1.2 millones en plataformas de administración de propiedades digitales en 2023. La tasa de adopción tecnológica de la compañía para sistemas de administración de propiedades basados en la nube alcanzó el 87% en su cartera.
| Categoría de inversión tecnológica | 2023 Gastos | Porcentaje de adopción |
|---|---|---|
| Plataformas de administración de propiedades digitales | $1,200,000 | 87% |
| Aplicaciones móviles de inquilino | $450,000 | 72% |
| Sistemas de pago de alquiler en línea | $350,000 | 65% |
Tecnologías de construcción inteligentes que mejoran la eficiencia operativa
WHLR implementó sensores IoT en 43 propiedades, lo que resultó en una reducción del 22% en el consumo de energía. Las inversiones de tecnología de construcción inteligente de la compañía totalizaron $ 2.1 millones en 2023.
| Tipo de tecnología inteligente | Propiedades implementadas | Ahorro de costos |
|---|---|---|
| Sensores de gestión de energía de IoT | 43 | 22% de reducción de energía |
| Sistemas HVAC automatizados | 38 | 18% de reducción de costos operativos |
Inversiones de ciberseguridad que protegen las transacciones inmobiliarias y los datos del inquilino
Wheeler REIT asignó $ 750,000 a la infraestructura de seguridad cibernética en 2023, implementando protocolos de cifrado avanzados y sistemas de autenticación multifactor en sus plataformas digitales.
| Medida de ciberseguridad | Inversión | Cobertura de implementación |
|---|---|---|
| Protocolos de cifrado avanzados | $350,000 | Plataformas 100% digitales |
| Autenticación multifactor | $250,000 | 95% de puntos de acceso de usuario |
| Sistemas de monitoreo de seguridad | $150,000 | Todas las redes corporativas |
Adopción de tours de propiedad virtual y plataformas de arrendamiento digital
WHLR amplió sus capacidades de gira virtual, con el 62% de las propiedades que ahora ofrecen tutoriales digitales 3D. Las inversiones de plataforma de arrendamiento digital alcanzaron $ 580,000 en 2023.
| Tecnología de arrendamiento digital | Inversión | Tasa de adopción |
|---|---|---|
| Tours de propiedad virtual 3D | $380,000 | 62% de las propiedades |
| Plataformas de arrendamiento en línea | $200,000 | 55% de transacciones de arrendamiento |
Wheeler Real Estate Investment Trust, Inc. (WHLR) - Análisis de mortero: factores legales
Regulaciones de cumplimiento de REIT que rigen la distribución del ingreso y el estado fiscal
Requisitos de cumplimiento:
| Parámetro de regulación REIT | Requisito específico | Umbral de cumplimiento |
|---|---|---|
| Distribución de dividendos | Distribución anual mínima | 90% de los ingresos imponibles |
| Composición de activos | Activos inmobiliarios | 75% de los activos totales |
| Fuente de ingresos | Ingresos relacionados con bienes raíces | 75% del ingreso bruto |
Leyes de vivienda justa y antidiscriminatoria que afectan la administración de la propiedad
Áreas clave de cumplimiento regulatorio:
- Prohibiciones de la Ley de Vivienda Justa
- Requisitos de la Ley de Americanos con Discapacidades
- Ley de Igualdad de Oportunidades de Crédito
| Regulación legal | Rango fino potencial | Agencia de aplicación |
|---|---|---|
| Violación de la Ley de Vivienda Justa | $ 16,000 - $ 65,000 por violación | Departamento de Vivienda y Desarrollo Urbano |
| Incumplimiento de ADA | $ 75,000 Primera violación | Departamento de Justicia |
Requisitos de cumplimiento ambiental para el desarrollo de la propiedad
Regulaciones ambientales clave:
| Regulación ambiental | Requisito de cumplimiento | Penalización potencial |
|---|---|---|
| Acto de aire limpio | Monitoreo de emisiones | Hasta $ 97,229 por día por violación |
| Acto de agua limpia | Gestión de aguas pluviales | Hasta $ 56,460 por día por violación |
| Ley de conservación y recuperación de recursos | Gestión de residuos | Hasta $ 74,552 por día por violación |
Posibles riesgos de litigios en adquisiciones de propiedades y gestión
| Categoría de litigio | Costo legal promedio | Frecuencia de ocurrencia |
|---|---|---|
| Litigio de disputas de propiedad | $75,000 - $250,000 | 2-3 casos por año |
| Demanda de derechos de los inquilinos | $50,000 - $150,000 | 1-2 casos por año |
| Litigio de incumplimiento del contrato | $100,000 - $300,000 | 1-2 casos por año |
Wheeler Real Estate Investment Trust, Inc. (WHLR) - Análisis de mortero: factores ambientales
Creciente énfasis en prácticas de construcción sostenibles y certificaciones verdes
A partir de 2024, Wheeler Real Estate Investment Trust ha implementado estrategias de construcción ecológica en su cartera. Niveles de certificación LEED alcanzados:
| Nivel de certificación | Número de propiedades | Hoques cuadrados totales |
|---|---|---|
| LEED certificado | 12 | 384,500 pies cuadrados |
| Plateado | 8 | 256,300 pies cuadrados |
| Oro leed | 3 | 96,120 pies cuadrados |
Impacto del cambio climático en la resiliencia de la propiedad y los costos de seguro
Aumentos de costos de seguro relacionados con el clima para las propiedades de WHLR:
| Año | Aumento de la prima del seguro | Propiedades de la región de alto riesgo |
|---|---|---|
| 2022 | 7.2% | 18 propiedades |
| 2023 | 9.5% | 22 propiedades |
| 2024 | 11.3% | 26 propiedades |
Inversiones de eficiencia energética en la cartera de propiedades existentes
Desglose de inversión de eficiencia energética:
| Categoría de inversión | Inversión total | Ahorros anuales proyectados |
|---|---|---|
| Instalación del panel solar | $3,200,000 | $480,000 |
| Actualizaciones de iluminación LED | $1,750,000 | $262,500 |
| Mejoras de eficiencia de HVAC | $2,500,000 | $375,000 |
Aumento de la demanda de inversores e inquilinos de activos inmobiliarios ambientalmente responsables
Métricas de desempeño ambiental:
- Reducción de emisiones de carbono: 22% desde 2020
- Reducción del consumo de agua: 18% en toda la cartera
- Uso de energía renovable: 35% del consumo total de energía
| Preferencia de sostenibilidad del inquilino | Porcentaje |
|---|---|
| Prefiere propiedades certificadas por verde | 67% |
| Dispuesto a pagar la prima por espacios sostenibles | 53% |
Wheeler Real Estate Investment Trust, Inc. (WHLR) - PESTLE Analysis: Social factors
You're looking at how people's lives are changing and how that directly impacts the tenants you want to attract to Wheeler Real Estate Investment Trust, Inc.'s properties. The social environment right now is defined by where people are choosing to live and how tightly they are holding onto their wallets.
Demographic shift to Sun Belt and suburban areas increases foot traffic at centers
The big story in US demographics through the first half of 2025 is the continued, robust migration to the Sun Belt and surrounding suburban communities. People are still leaving high-cost core cities for what they perceive as better quality of life and more affordable housing, especially in the Southeast. For Wheeler Real Estate Investment Trust, Inc., whose portfolio has geographic concentration in the Mid-Atlantic and Southeast, this is a tailwind. This population influx means more local residents needing daily services, which translates directly into higher potential foot traffic for your centers, assuming your properties are in the right submarkets within those booming regions. This trend has been strong, with the South gaining a staggering 2,685,000 net domestic migrants between July 2020 and July 2024, according to Newgeography data. Still, you need to watch the local execution; simply being in the Southeast isn't enough.
Here's a quick look at WHLR's current standing:
| Metric (as of June 30, 2025) | Value | Context |
| Portfolio Occupancy Rate | 91.6% | An 80 basis point increase from 90.8% |
| Real Estate, Net | $510.7 million | Total as of June 30, 2025 |
Consumer preference for convenience drives demand for necessity-based, one-stop retail
Shoppers today, regardless of generation, demand convenience for their routine stops. They don't want to drive across town for one item; they want a destination that handles multiple errands efficiently. This means necessity-based retail-think grocery stores, pharmacies, and quick-service food-is gold. The market is actively rewarding centers that can deliver this one-stop capability. This preference is why landlords are actively seeking out tenants that provide daily utility, which helps maintain consistent traffic flow across the entire property, even when discretionary spending is tight. It's about making the trip worthwhile.
Tenant mix must evolve to include essential services like healthcare and fitness, not just retail
To truly capture that convenience factor, the tenant mix needs to go beyond just selling goods. We are seeing a major push to integrate essential services, particularly healthcare and wellness, into retail properties. Medical tenants, like urgent care clinics and specialized outpatient providers, are increasingly taking up former big-box spaces because retail locations offer better patient access and ample parking than traditional medical office buildings. Fitness clubs are also a strong category, with activity seen across both high-amenity, spa-like models and budget-oriented, no-frills setups. This diversification is key; healthcare is generally recession-resistant, which de-risks the asset for Wheeler Real Estate Investment Trust, Inc. Your centers must reflect this reality to attract the best, most stable rents.
The evolution of tenant types is clear:
- Integrate urgent care and dental clinics.
- Attract fitness centers across the spectrum.
- Focus on daily-needs grocery anchors.
- Replace pure retail with service providers.
High cost of living pushes consumers to value price, benefiting value-oriented grocery anchors
Honestly, the persistent high cost of living is forcing consumers to shop smarter, and that means value is paramount, especially for necessities like groceries. Data from late 2024 into 2025 shows consumers are actively stretching their budgets. For instance, in November 2024, 69% of shoppers reported looking for sales and deals more often. Furthermore, 49% reported switching to a less expensive brand. This environment strongly favors grocery anchors that are known for value, like discount chains or those with strong private-label offerings-sales of own-label products are outpacing national brands. What this estimate hides, though, is that pure discount isn't the only play; shoppers still want convenience and variety, meaning the best value anchors will be those that balance low prices with a good selection of essentials. If a center's main grocery anchor is perceived as too expensive, you'll see tenants struggle, which is a risk Wheeler Real Estate Investment Trust, Inc. must manage across its portfolio. For the three months ending June 30, 2025, WHLR reported a net loss attributable to common stockholders of $(9.45) per share, showing the financial pressures felt across the sector.
Finance: draft 13-week cash view by Friday.
Wheeler Real Estate Investment Trust, Inc. (WHLR) - PESTLE Analysis: Technological factors
You're managing a portfolio of physical retail centers in 2025, and the tech landscape isn't just about having a website anymore; it dictates operational survival and tenant appeal. The core challenge is integrating digital convenience with physical space, which means capital planning must account for significant tech upgrades.
E-commerce fulfillment (click-and-collect) requires costly redesign of parking lots and store layouts
The 'buy online, pick up in-store' (BOPIS) model is now standard, not a bonus, meaning your centers need dedicated, efficient infrastructure for curb-side pickup. This isn't a simple painted line; it requires reallocating valuable square footage, often from traditional parking, to designated pickup zones. Honestly, construction costs are still high-about 30-40% above pre-pandemic levels-making any physical redesign a major capital expenditure for a REIT like Wheeler Real Estate Investment Trust, Inc.. If onboarding these omnichannel capabilities takes too long, you risk losing anchor tenants who need that seamless last-mile integration to compete.
Here are the implications for physical space adaptation:
- Designate secure, easy-access pickup zones.
- Rethink back-of-house space for staging orders.
- Ensure fast last-mile logistics connectivity.
Property management systems use AI to optimize energy consumption and maintenance schedules
For operational efficiency, AI is moving from pilot programs to core functionality in property management. For a REIT focused on operational efficiency, this is where you find immediate savings. Predictive maintenance, powered by AI monitoring building systems like HVAC and plumbing, helps identify issues before they become costly failures. In the multifamily sector, 94% of businesses on one major platform are already using AI capabilities to support operations in 2025. This technology streamlines repetitive tasks, freeing up your property managers to focus on higher-value tenant relations rather than manual scheduling.
Data analytics help refine tenant mix based on hyper-local consumer spending patterns
Guesswork in leasing is a recipe for underperformance, especially with thin margins across the retail sector. Landlords are now using property intelligence tools to generate robust tenant-mix recommendations and forecast vacancy risk. In fact, 54% of shopping center owners relied on predictive analytics for decisions on subdividing space or forecasting rent growth as of late 2024. The right data can be worth tens of millions; one case study showed advanced geo-analytics cut an apparel chain's underperforming store ratio by 32%. For Wheeler Real Estate Investment Trust, Inc., this means cross-referencing local median incomes and mobile phone location data to ensure every square foot is leased to the most resilient and profitable concept for that specific submarket.
Digital marketing tools are essential for driving traffic to physical centers
Physical retail is now inextricably linked to the digital sphere; stores must create memorable, 'Instagram-worthy' moments to draw shoppers in. Retailers who successfully blend digital convenience with in-person experiences are seeing average store-level profit margins that are 2-3 percentage points higher than those relying on static forecasting. This means your leasing strategy must favor tenants who invest in digital engagement, as their success directly supports the foot traffic and perceived value of your centers. The entire ecosystem demands digital agility.
Here is a snapshot of the technological adoption landscape in CRE for 2025:
| Technology Focus Area | 2025 Industry Adoption/Metric | Impact on REIT Operations |
| AI in Property Management | 94% of businesses on one platform use AI capabilities | Drives operational efficiency; enables predictive maintenance. |
| Predictive Analytics for Leasing | 54% of shopping center owners use it for mix/vacancy forecasting | Reduces leasing risk; improves forecasted rent growth stability. |
| Retail Analytics for Tenants | Retailers using advanced analytics see 2-3% higher store-level margins | Attracts higher-quality, more resilient tenants. |
| Construction Costs (Proxy for Redesign) | Costs are 30-40% above pre-pandemic levels | Increases capital outlay required for physical fulfillment upgrades. |
Finance: draft 13-week cash view by Friday
Wheeler Real Estate Investment Trust, Inc. (WHLR) - PESTLE Analysis: Legal factors
You are navigating a landscape where every square foot of your 75 properties, totaling approximately 7.66 million leasable square feet as of December 31, 2024, is subject to a patchwork of federal, state, and local rules. This legal complexity is a constant operational drag, even if management doesn't foresee massive, immediate outlays.
Compliance with Americans with Disabilities Act (ADA) requires ongoing capital investment across the portfolio.
The ADA mandates accessibility, which means every time you renovate or even address a major repair in one of your Mid-Atlantic, Southeast, or Northeast centers, you face potential compliance upgrades. While management stated in March 2025 that they do not expect any material costs for compliance with environmental, health, or safety laws for the fiscal year ending December 31, 2025, this is a forward-looking statement, not a guarantee against a specific ADA claim or a sudden local code revision. Honestly, the risk is baked into the cost of capital improvements. For instance, adding an elevator or a ramp during a necessary renovation can significantly increase the project budget, as standard commercial property insurance often excludes these specific code upgrade costs unless you carry a specific endorsement.
Landlord-tenant laws vary by state, complicating lease enforcement and property management.
Since your portfolio spans multiple states, you are dealing with different rules for everything from security deposits to eviction timelines. We see this playing out nationally in 2025 with significant shifts. For example, New York City implemented the Fairness in Apartment Rental Expenses (FARE) Act on June 11, 2025, shifting the burden of broker fees-which could be up to 15% of annual rent-from the tenant to the landlord. While your retail leases might be structured differently, these state-level shifts signal increasing regulatory focus on tenant protections. If you have any multi-family components or face litigation in a state like New York, this is a direct cost impact. Also, California introduced new rules in 2025, like mandatory water storage tank disclosures and revised foreclosure protections. You need to ensure your lease enforcement strategy is localized and current for every jurisdiction where you operate.
Strict adherence to REIT qualification tests is mandatory to maintain tax-advantaged status.
This is non-negotiable. If you fail the tests, you lose the tax benefits, and the IRS can hit you with corporate tax rates. To keep your REIT status, you must distribute at least 90% of your taxable income to stockholders and meet strict asset and income tests quarterly and annually. For the year ended December 31, 2024, your reported Net Income was $0.8 million. That means the required distribution floor was at least $0.72 million (90% of $0.8 million). The asset test requires that at the close of each quarter, at least 75% of your total assets must be in real estate assets, cash, or government securities. This requires constant monitoring of your balance sheet, especially after acquisitions or dispositions. Here's the quick math: your asset base must be structured correctly to avoid a massive tax bill.
Here is a quick look at the core REIT requirements:
| Requirement Category | Test Threshold | Frequency | Consequence of Failure |
| Income Test (75%) | 75% of Gross Income from Real Estate Sources | Annually | Loss of REIT status for 5 years (unless reasonable cause) |
| Income Test (95%) | 95% of Gross Income from Passive/Real Estate Sources | Annually | Loss of REIT status for 5 years (unless reasonable cause) |
| Asset Test (75%) | 75% of Total Assets in Real Estate Assets/Cash/Govt Securities | Quarterly | Loss of REIT status for 5 years (unless reasonable cause) |
| Distribution Requirement | Distribute at least 90% of Taxable Income | Annually | Taxed at regular corporate rates for the non-compliant year |
Local building codes and fire safety regulations mandate specific, costly upgrades during renovations.
Beyond ADA, local jurisdictions dictate the specifics of your physical plant. When you plan value-add improvements, you must budget for compliance with the latest local building codes, which are constantly evolving. For example, in some regions, new commercial codes in 2025 are pushing infrastructure requirements, like mandating support for higher wattage Power over Ethernet (PoE++ up to 90W) for communications and safety systems. What this estimate hides is the cost variance; construction costs in a market like Los Angeles can be 25-28% higher than historical trends through 2025 for materials alone, while Texas markets like Houston face higher costs due to stringent windstorm codes.
Key areas demanding proactive legal and capital planning include:
- Accessibility compliance for all public areas.
- Fire suppression system certifications and upgrades.
- Energy efficiency mandates in major renovation projects.
- Compliance with evolving low-voltage/data infrastructure standards.
If onboarding takes 14+ days, churn risk rises, but if a renovation permit is delayed by code review, that delay is defintely more costly.
Finance: draft 13-week cash view by Friday
Wheeler Real Estate Investment Trust, Inc. (WHLR) - PESTLE Analysis: Environmental factors
You're managing a portfolio of strip centers and retail properties, and the environmental landscape is shifting from a compliance footnote to a core financial driver. Honestly, ignoring the 'E' in ESG is no longer an option for a publicly-traded REIT like Wheeler Real Estate Investment Trust, Inc. Institutional investors are demanding quantifiable proof of resilience, and your tenants are basing leasing decisions on your sustainability profile.
Increased investor and tenant pressure for Environmental, Social, and Governance (ESG) reporting
The market in 2025 treats ESG data as a right to play, not a bonus. Investors are scrutinizing disclosures aligned with frameworks like the ISSB, knowing that companies without credible data risk exclusion from major capital pools. For Wheeler Real Estate Investment Trust, Inc., this means transparent reporting on energy use and carbon footprint is non-negotiable to maintain equity market valuations, which REITs with higher sustainable properties currently enjoy. We know that green-certified buildings, for example, can cost 9-14% less to operate than standard properties, which directly impacts Net Operating Income (NOI).
What this estimate hides is the operational lift required to get that certification. If onboarding takes 14+ days, churn risk rises.
- ESG data is now integral to financial management.
- Investor scrutiny targets portfolio resilience.
- Tenant preference drives demand for green spaces.
Climate change risk (e.g., flooding) in coastal properties demands higher insurance premiums, up 15% year-over-year
For the properties Wheeler Real Estate Investment Trust, Inc. holds along the Mid-Atlantic and Southeast coasts, the physical risk from climate volatility is translating directly to the balance sheet via insurance. Insurers are recalibrating risk models based on more intense storms and rising sea levels. We are seeing coastal property insurance premiums rise by an estimated 15% year-over-year as carriers demand higher reserves. This is a direct hit to operating expenses that eats into Funds From Operations (FFO).
To be fair, this is a sector-wide issue, but for a REIT with a concentrated portfolio, it demands immediate action. In some high-risk areas, the combination of primary and secondary policies can drive total premium increases up to 50 to 70 percent.
Here's a quick look at how these environmental pressures manifest:
| Environmental Factor | 2025 Impact Metric | Actionable Insight |
|---|---|---|
| Climate Risk (Coastal) | Insurance premiums up 15% YoY | Mandate immediate, granular property-level risk assessments. |
| Energy Efficiency Mandates | New SEER minimums (e.g., 14.0 or 15.0) | Budget for proactive HVAC replacement cycles, not just failure. |
| EV Infrastructure Demand | 71 million EVs predicted on US roads by 2025 | Prioritize anchor tenant/high-traffic locations for Level 2 chargers. |
| Operational Savings (Green Cert) | Operating cost reduction of 9-14% | Use potential savings to justify capital allocation for retrofits. |
Energy efficiency mandates require upgrades to HVAC and lighting systems to meet new standards
New federal and state energy codes are forcing capital deployment into existing assets. Starting in 2025, new minimum efficiency standards for HVAC equipment are taking effect; for instance, in some regions, the minimum SEER rating for air conditioning units is increasing from 13.0 to 14.0, or 14.0 to 15.0 in Southern states. Furthermore, the mandated shift to low-Global Warming Potential (GWP) refrigerants like R-454B means that when an old unit fails, the replacement cost is higher, but the new system might offer up to 5% better energy efficiency.
You need to look at your capital plan for the 2025 fiscal year and see where you can bundle lighting retrofits with necessary HVAC replacements to maximize benefits, like the 179D Tax Deduction for energy-saving commercial building property improvements.
Tenant demand for electric vehicle (EV) charging stations requires new infrastructure investment
Tenants are actively looking for properties that support their own sustainability goals and daily needs, and EV charging is rapidly becoming a standard amenity, not a perk. With Bloomberg predicting 71 million plug-in vehicles on the road by 2025, waiting to install chargers means losing out on high-quality, long-term tenants. We are seeing tenants demand this infrastructure before lease renewals.
Strategically-placed chargers can attract customers who do about 30% of their charging away from home, which boosts sales for your retail tenants. The investment is about future-proofing occupancy and potentially increasing property value, so start mapping out the electrical capacity now. Finance: draft 13-week cash view by Friday, specifically modeling the upfront capital outlay for a phased EV charging rollout across the top five portfolio assets.
Disclaimer
All information, articles, and product details provided on this website are for general informational and educational purposes only. We do not claim any ownership over, nor do we intend to infringe upon, any trademarks, copyrights, logos, brand names, or other intellectual property mentioned or depicted on this site. Such intellectual property remains the property of its respective owners, and any references here are made solely for identification or informational purposes, without implying any affiliation, endorsement, or partnership.
We make no representations or warranties, express or implied, regarding the accuracy, completeness, or suitability of any content or products presented. Nothing on this website should be construed as legal, tax, investment, financial, medical, or other professional advice. In addition, no part of this site—including articles or product references—constitutes a solicitation, recommendation, endorsement, advertisement, or offer to buy or sell any securities, franchises, or other financial instruments, particularly in jurisdictions where such activity would be unlawful.
All content is of a general nature and may not address the specific circumstances of any individual or entity. It is not a substitute for professional advice or services. Any actions you take based on the information provided here are strictly at your own risk. You accept full responsibility for any decisions or outcomes arising from your use of this website and agree to release us from any liability in connection with your use of, or reliance upon, the content or products found herein.