
|
Valoración de DCF de Wizz Air Holdings PLC (Wizz.L) |
Completamente Editable: Adáptelo A Sus Necesidades En Excel O Sheets
Diseño Profesional: Plantillas Confiables Y Estándares De La Industria
Predeterminadas Para Un Uso Rápido Y Eficiente
Compatible con MAC / PC, completamente desbloqueado
No Se Necesita Experiencia; Fáciles De Seguir
Wizz Air Holdings Plc (WIZZ.L) Bundle
¡Explore las perspectivas financieras de Wizz Air Holdings PLC con nuestra calculadora DCF fácil de usar! Ingrese sus suposiciones con respecto al crecimiento, los márgenes y los costos para calcular el valor intrínseco de Wizz Air Holdings PLC y mejorar su enfoque de inversión.
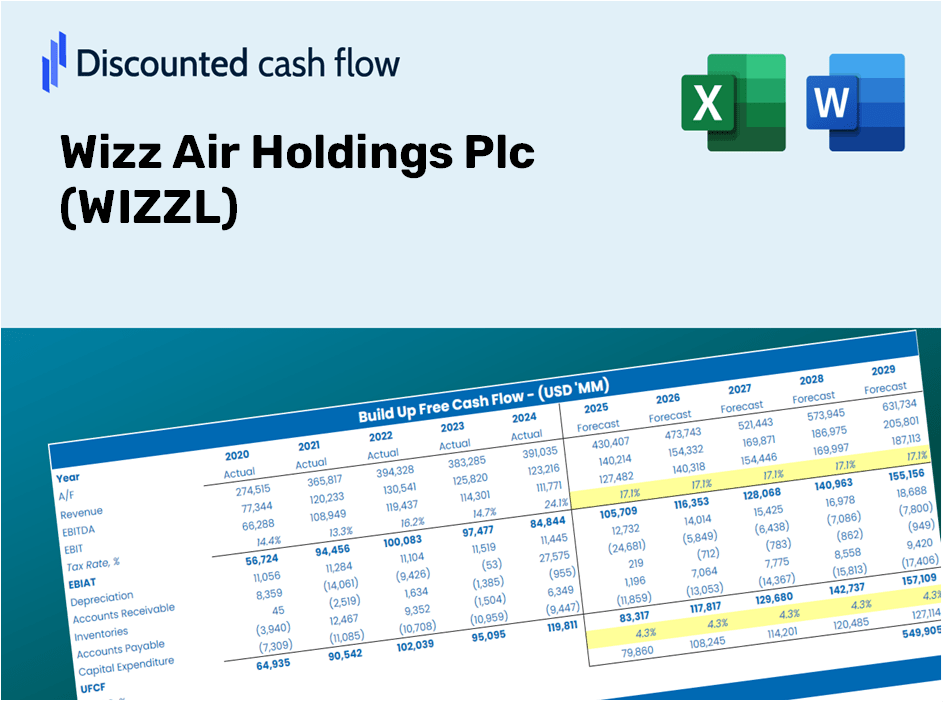
Discounted Cash Flow (DCF) - (USD MM)
| Year | AY1 2020 |
AY2 2021 |
AY3 2022 |
AY4 2023 |
AY5 2024 |
FY1 2025 |
FY2 2026 |
FY3 2027 |
FY4 2028 |
FY5 2029 |
|---|---|---|---|---|---|---|---|---|---|---|
| Revenue | 651.4 | 1,466.4 | 3,434.2 | 4,472.1 | 4,643.5 | 7,360.6 | 11,667.6 | 18,494.9 | 29,317.0 | 46,471.7 |
| Revenue Growth, % | 0 | 125.1 | 134.19 | 30.22 | 3.83 | 58.51 | 58.51 | 58.51 | 58.51 | 58.51 |
| EBITDA | -126.2 | -93.2 | 151.4 | 1,139.9 | 1,089.6 | 406.7 | 644.7 | 1,022.0 | 1,620.0 | 2,568.0 |
| EBITDA, % | -19.38 | -6.35 | 4.41 | 25.49 | 23.46 | 5.53 | 5.53 | 5.53 | 5.53 | 5.53 |
| Depreciation | 304.0 | 393.4 | 529.9 | 665.8 | 852.3 | 1,798.5 | 2,850.9 | 4,519.1 | 7,163.4 | 11,355.1 |
| Depreciation, % | 46.67 | 26.83 | 15.43 | 14.89 | 18.35 | 24.43 | 24.43 | 24.43 | 24.43 | 24.43 |
| EBIT | -430.3 | -486.6 | -378.5 | 474.1 | 237.3 | -1,391.8 | -2,206.2 | -3,497.1 | -5,543.4 | -8,787.1 |
| EBIT, % | -66.05 | -33.18 | -11.02 | 10.6 | 5.11 | -18.91 | -18.91 | -18.91 | -18.91 | -18.91 |
| Total Cash | 1,276.0 | 1,072.5 | 1,241.7 | 1,304.2 | 1,461.3 | 3,973.7 | 6,298.8 | 9,984.5 | 15,826.9 | 25,087.8 |
| Total Cash, percent | .0 | .0 | .0 | .0 | .0 | .0 | .0 | .0 | .0 | .0 |
| Account Receivables | 164.8 | 84.9 | 149.9 | 590.4 | 492.8 | 872.4 | 1,382.8 | 2,192.0 | 3,474.6 | 5,507.8 |
| Account Receivables, % | 25.29 | 5.79 | 4.37 | 13.2 | 10.61 | 11.85 | 11.85 | 11.85 | 11.85 | 11.85 |
| Inventories | 47.3 | 62.5 | 260.6 | 294.1 | 239.7 | 454.2 | 720.0 | 1,141.3 | 1,809.1 | 2,867.7 |
| Inventories, % | 7.27 | 4.26 | 7.59 | 6.58 | 5.16 | 6.17 | 6.17 | 6.17 | 6.17 | 6.17 |
| Accounts Payable | 107.8 | 123.4 | 153.1 | 190.3 | 203.4 | 560.3 | 888.1 | 1,407.8 | 2,231.6 | 3,537.4 |
| Accounts Payable, % | 16.55 | 8.42 | 4.46 | 4.26 | 4.38 | 7.61 | 7.61 | 7.61 | 7.61 | 7.61 |
| Capital Expenditure | -479.9 | -564.1 | -624.9 | -624.9 | -569.0 | -2,304.7 | -3,653.4 | -5,791.1 | -9,179.7 | -14,551.1 |
| Capital Expenditure, % | -73.67 | -38.47 | -18.2 | -13.97 | -12.25 | -31.31 | -31.31 | -31.31 | -31.31 | -31.31 |
| Tax Rate, % | -1046.19 | -1046.19 | -1046.19 | -1046.19 | -1046.19 | -1046.19 | -1046.19 | -1046.19 | -1046.19 | -1046.19 |
| EBITAT | -434.5 | -479.2 | -350.6 | 523.4 | 2,720.0 | -1,367.1 | -2,167.0 | -3,435.0 | -5,445.0 | -8,631.0 |
| Depreciation | ||||||||||
| Changes in Account Receivables | ||||||||||
| Changes in Inventories | ||||||||||
| Changes in Accounts Payable | ||||||||||
| Capital Expenditure | ||||||||||
| UFCF | -714.7 | -569.6 | -679.1 | 127.6 | 3,168.2 | -2,110.5 | -3,417.8 | -5,417.7 | -8,587.9 | -13,613.0 |
| WACC, % | 5.45 | 5.4 | 5.22 | 5.45 | 5.45 | 5.4 | 5.4 | 5.4 | 5.4 | 5.4 |
| PV UFCF | ||||||||||
| SUM PV UFCF | -27,134.6 | |||||||||
| Long Term Growth Rate, % | 2.00 | |||||||||
| Free cash flow (T + 1) | -13,885 | |||||||||
| Terminal Value | -408,985 | |||||||||
| Present Terminal Value | -314,489 | |||||||||
| Enterprise Value | -341,624 | |||||||||
| Net Debt | 5,304 | |||||||||
| Equity Value | -346,927 | |||||||||
| Diluted Shares Outstanding, MM | 128 | |||||||||
| Equity Value Per Share | -271,621.41 |
What You Will Receive
- Customizable Excel Template: A fully adaptable Excel-based DCF Calculator featuring pre-populated financials for Wizz Air Holdings Plc (WIZZL).
- Current Market Data: Access to historical figures and forward-looking projections (highlighted in the yellow cells).
- Flexible Forecasting: Modify assumptions such as revenue growth, EBITDA percentage, and WACC.
- Instant Calculations: Quickly observe how your inputs affect Wizz Air’s valuation.
- Professional Resource: Designed for investors, CFOs, consultants, and financial analysts.
- Intuitive Interface: Organized for clarity and usability, complemented by step-by-step guidance.
Key Features
- Real-Time WIZZL Data: Pre-loaded with Wizz Air’s historical financial performance and future projections.
- Comprehensive Customization Options: Modify revenue growth rates, profit margins, weighted average cost of capital (WACC), tax rates, and capital expenditure assumptions.
- Interactive Valuation Model: Automatically recalculates Net Present Value (NPV) and intrinsic value based on your adjustments.
- Scenario Analysis: Develop various forecast scenarios to assess different valuation possibilities.
- User-Centric Interface: Intuitive and well-organized, suitable for both industry professionals and novices.
How It Works
- Step 1: Download the prebuilt Excel template containing data for Wizz Air Holdings Plc (WIZZL).
- Step 2: Navigate through the pre-filled sheets to familiarize yourself with the key performance indicators.
- Step 3: Modify the forecasts and assumptions in the editable yellow cells (WACC, growth rate, margins).
- Step 4: Instantly see the updated results, including the intrinsic value of Wizz Air Holdings Plc (WIZZL).
- Step 5: Make well-informed investment choices or create reports based on the outputs.
Why Choose This Calculator for Wizz Air Holdings Plc (WIZZL)?
- Precision: Leveraging accurate financial data from Wizz Air ensures reliable results.
- Customizability: Users can easily adjust and test inputs to suit their specific needs.
- Efficiency: Eliminate the complexities of creating a DCF model from the ground up.
- Expert-Level: Crafted with the expertise and precision suited for CFOs.
- Intuitive Interface: Simple to navigate, making it accessible for all users, regardless of their financial background.
Who Can Benefit from This Product?
- Investors: Evaluate Wizz Air's valuation before making stock purchases or sales.
- CFOs and Financial Analysts: Enhance valuation processes and assess financial projections.
- Startup Founders: Discover how established companies like Wizz Air are valued in the market.
- Consultants: Provide comprehensive valuation reports for your clients.
- Students and Educators: Utilize real-world data to learn and teach valuation methodologies.
Contents of the Wizz Air Template
- Preloaded WIZZL Data: Historical and forecasted financial information, including revenue, EBIT, and capital expenses.
- DCF and WACC Models: Comprehensive spreadsheets for determining intrinsic value and the Weighted Average Cost of Capital.
- Editable Inputs: Cells highlighted in yellow for modifying revenue growth rates, tax percentages, and discount rates.
- Financial Statements: Detailed annual and quarterly financials for enhanced analysis.
- Key Ratios: Ratios related to profitability, leverage, and efficiency to assess performance.
- Dashboard and Charts: Visual representations of valuation results and underlying assumptions.
Disclaimer
All information, articles, and product details provided on this website are for general informational and educational purposes only. We do not claim any ownership over, nor do we intend to infringe upon, any trademarks, copyrights, logos, brand names, or other intellectual property mentioned or depicted on this site. Such intellectual property remains the property of its respective owners, and any references here are made solely for identification or informational purposes, without implying any affiliation, endorsement, or partnership.
We make no representations or warranties, express or implied, regarding the accuracy, completeness, or suitability of any content or products presented. Nothing on this website should be construed as legal, tax, investment, financial, medical, or other professional advice. In addition, no part of this site—including articles or product references—constitutes a solicitation, recommendation, endorsement, advertisement, or offer to buy or sell any securities, franchises, or other financial instruments, particularly in jurisdictions where such activity would be unlawful.
All content is of a general nature and may not address the specific circumstances of any individual or entity. It is not a substitute for professional advice or services. Any actions you take based on the information provided here are strictly at your own risk. You accept full responsibility for any decisions or outcomes arising from your use of this website and agree to release us from any liability in connection with your use of, or reliance upon, the content or products found herein.