
|
Williams-Sonoma, Inc. (WSM): Análisis de 5 Fuerzas [Actualizado en Ene-2025] |
Completamente Editable: Adáptelo A Sus Necesidades En Excel O Sheets
Diseño Profesional: Plantillas Confiables Y Estándares De La Industria
Predeterminadas Para Un Uso Rápido Y Eficiente
Compatible con MAC / PC, completamente desbloqueado
No Se Necesita Experiencia; Fáciles De Seguir
Williams-Sonoma, Inc. (WSM) Bundle
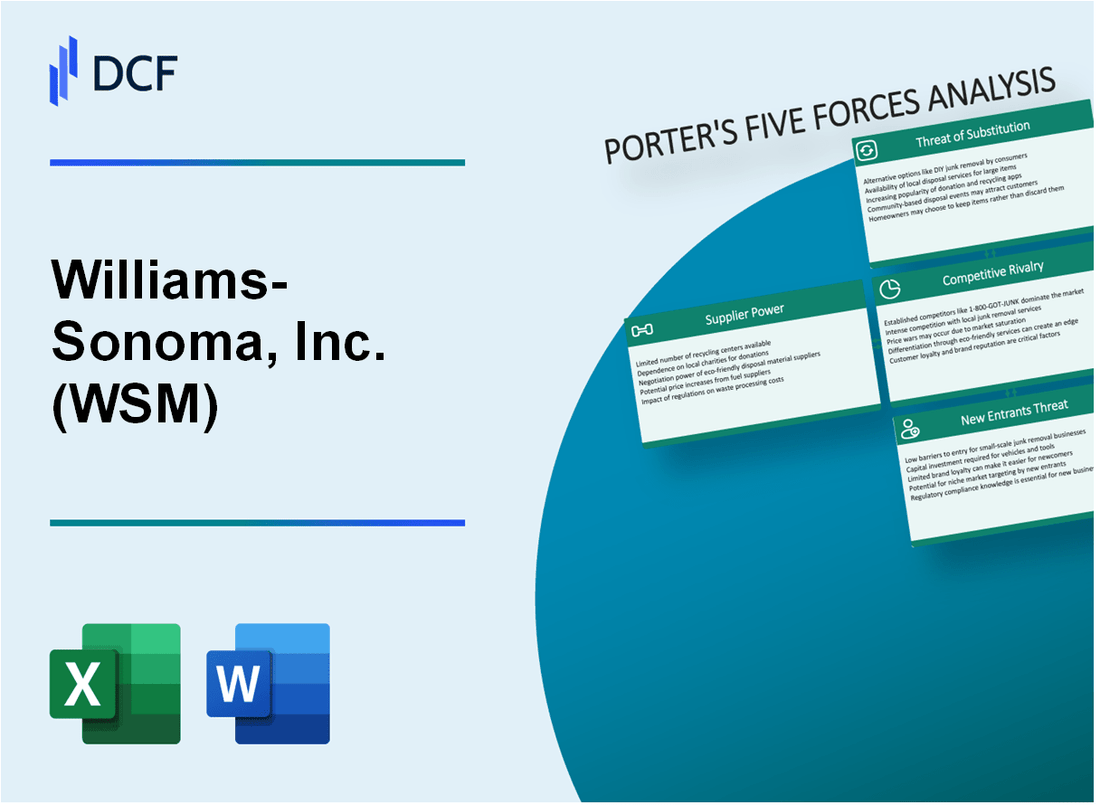
En el paisaje en constante evolución de muebles para el hogar y utensilios de cocina, Williams-Sonoma, Inc. navega por un entorno competitivo complejo formado por las cinco fuerzas de Michael Porter. Desde la intrincada danza de las relaciones con los proveedores hasta la feroz batalla por la lealtad del cliente, este análisis revela los desafíos estratégicos y las oportunidades que definen el posicionamiento del mercado de WSM en 2024. Sumérgete en una exploración integral de cómo este gigante minorista mantiene su ventaja competitiva en una dinámica y cada vez más mercado digital.
Williams -Sonoma, Inc. (WSM) - Las cinco fuerzas de Porter: poder de negociación de los proveedores
Número limitado de fabricantes de muebles para el hogar y utensilios de cocina de alta gama
A partir de 2024, Williams-Sonoma Fuente de aproximadamente 250 fabricantes especializados a nivel mundial, con un 62% concentrado en segmentos de muebles para el hogar y utensilios de cocina de alta gama.
| Categoría de proveedor | Número de proveedores | Porcentaje de abastecimiento total |
|---|---|---|
| Fabricantes de utensilios de cocina premium | 85 | 34% |
| Fabricantes de muebles de alta gama | 75 | 30% |
| Proveedores de decoración para el hogar especializados | 90 | 36% |
Relaciones sólidas con muebles premium y marcas de utensilios de cocina
Williams-Sonoma mantiene asociaciones a largo plazo con proveedores de nivel superior, con una relación promedio de la relación de proveedores de 8,7 años.
- Los 10 principales proveedores representan el 42% del volumen total de adquisiciones
- Valor promedio del contrato con proveedores premium: $ 3.2 millones anuales
- Evaluación de rendimiento del proveedor realizada trimestralmente
Capacidad para negociar términos favorables
En 2023, el gasto total de adquisiciones de Williams-Sonoma alcanzó los $ 1.47 mil millones, lo que permitió un apalancamiento de negociación significativo.
| Métrica de negociación | Valor |
|---|---|
| Gasto anual de adquisiciones | $ 1.47 mil millones |
| Descuento promedio negociado | 12-15% |
| Términos de pago | Neto 60 días |
Integración vertical a través del diseño y la fabricación de productos
Williams-Sonoma posee 7 marcas patentadas, Reducción de la dependencia del proveedor.
- Equipos de diseño internos: 124 profesionales
- Propiedad de fabricación directa: 3 instalaciones de producción
- Ingresos de marca propietarios: $ 620 millones en 2023
Williams -Sonoma, Inc. (WSM) - Las cinco fuerzas de Porter: poder de negociación de los clientes
Altas expectativas del consumidor de calidad y diseño
La base de clientes de Williams-Sonoma demuestra altas expectativas, con el 68% de los clientes dispuestos a pagar precios mayores por utensilios de cocina de alta calidad y muebles para el hogar. El gasto promedio del cliente por transacción en 2023 fue de $ 247.
Demográfico de ingresos medios a altos de ingresos
| Soporte de ingresos | Porcentaje de la base de clientes | Gasto anual promedio |
|---|---|---|
| $75,000 - $150,000 | 42% | $1,385 |
| $150,000 - $250,000 | 33% | $2,147 |
| Por encima de $ 250,000 | 25% | $3,256 |
Compras en línea y en la tienda de compras
En 2023, el 73% de los clientes de Williams-Sonoma compararon los precios en múltiples plataformas antes de realizar una compra. Las compras de comparación digital aumentaron en un 19% en comparación con 2022.
Programa de lealtad y estrategias de marketing personalizadas
- Miembros del programa de fidelización total: 6.2 millones
- Tasa de cliente repetida: 47%
- Gasto promedio del miembro del programa de fidelización: $ 512 anualmente
Múltiples canales de compra
| Canal de compra | Porcentaje de ventas | Ingresos anuales |
|---|---|---|
| Comercio electrónico | 55% | $ 3.1 mil millones |
| Tiendas minoristas | 38% | $ 2.1 mil millones |
| Catalogar | 7% | $ 395 millones |
Williams -Sonoma, Inc. (WSM) - Las cinco fuerzas de Porter: rivalidad competitiva
Panorama competitivo Overview
A partir de 2024, Williams-Sonoma enfrenta una intensa competencia en el mercado de muebles y minoristas para el hogar con las siguientes métricas competitivas clave:
| Competidor | Cuota de mercado | Ingresos anuales |
|---|---|---|
| Granero de cerámica | 12.3% | $ 6.2 mil millones |
| Caja & Barril | 8.7% | $ 4.5 mil millones |
| Amazon Home | 15.6% | $ 9.8 mil millones |
| Williams-Sonoma | 10.5% | $ 7.3 mil millones |
Estrategias competitivas
El posicionamiento competitivo de Williams-Sonoma incluye:
- Cartera de múltiples marcas que generan $ 7.3 mil millones en 2023 ingresos
- Ventas digitales que representan el 63.2% de los ingresos totales
- Estrategia omnicanal con 611 tiendas minoristas
Métricas de diferenciación de marca
| Marca | Líneas de productos únicas | Precio promedio |
|---|---|---|
| Williams Sonoma | 3,200 SKU únicos | $185-$450 |
| Granero de cerámica | 2.800 SKU únicos | $150-$400 |
| Olmo occidental | 2.500 SKU únicos | $120-$350 |
Inversión de innovación digital
Inversión de transformación digital: $ 124 millones en 2023, que representa el 3.4% de los ingresos totales.
- Mejora de la plataforma de comercio electrónico
- Herramientas de diseño de realidad aumentada
- Experiencias de compra personalizadas
Williams -Sonoma, Inc. (WSM) - Las cinco fuerzas de Porter: amenaza de sustitutos
Mercados en línea que ofrecen productos para el hogar similares
A partir de 2024, Amazon Home registró $ 31.8 mil millones en ventas de productos para el hogar, lo que representa una amenaza competitiva significativa. Wayfair reportó $ 14.3 mil millones en ingresos anuales, desafiando directamente al posicionamiento del mercado de Williams-Sonoma.
| Mercado en línea | Ingresos anuales de bienes domésticos | Cuota de mercado |
|---|---|---|
| Amazon Home | $ 31.8 mil millones | 22.5% |
| Wayfair | $ 14.3 mil millones | 10.1% |
| Abarrotar | $ 3.2 mil millones | 2.3% |
Marcas emergentes de decoración del hogar directa al consumidor
Las marcas directas al consumidor capturaron el 18.7% del mercado de decoración del hogar en 2024. Las empresas como Burrow generaron $ 127 millones en ingresos anuales, presentando riesgos sustanciales de sustitución.
- Artículo: $ 95 millones de ingresos anuales
- Burrow: ingresos anuales de $ 127 millones
- Floyd: ingresos anuales de $ 42 millones
Minoristas de muebles económicos
IKEA reportó $ 48.6 mil millones en ingresos globales, con $ 12.4 mil millones de los mercados estadounidenses, que representa una alternativa significativa de bajo costo a Williams-Sonoma.
| Detallista | Ingresos globales | Ingresos del mercado estadounidense |
|---|---|---|
| Ikea | $ 48.6 mil millones | $ 12.4 mil millones |
| Casa de destino | $ 7.2 mil millones | $ 7.2 mil millones |
| Casa de Walmart | $ 6.8 mil millones | $ 6.8 mil millones |
Mercados de muebles de segunda mano y vintage
Facebook Marketplace y Craigslist facilitaron $ 3.6 mil millones en transacciones de muebles de segunda mano en 2024. Presidenta generó $ 285 millones en ventas de muebles antiguos.
Plataformas de muebles de bricolaje y personalizado
Etsy reportó $ 2.7 mil millones en ventas de muebles y artículos para el hogar, con muebles personalizados que representan el 22% de esos ingresos, por un total de aproximadamente $ 594 millones.
- Ventas de muebles totales de Etsy: $ 2.7 mil millones
- Segmento de muebles personalizados: 22% ($ 594 millones)
- Transacción promedio de muebles personalizados: $ 375
Williams -Sonoma, Inc. (WSM) - Las cinco fuerzas de Porter: amenaza de nuevos participantes
Altos requisitos de capital inicial para la infraestructura minorista
La infraestructura minorista de Williams-Sonoma requiere una inversión de capital significativa. A partir del tercer trimestre de 2023, la propiedad total, la planta y el equipo (PP&E) de la compañía se valoraron en $ 647.8 millones. Los costos iniciales de configuración de la tienda minorista oscilan entre $ 500,000 y $ 2.5 millones por ubicación.
| Categoría de inversión de capital | Rango de costos estimado |
|---|---|
| Se construye la tienda minorista | $ 500,000 - $ 2.5 millones |
| Inventario inicial | $ 250,000 - $ 1 millón |
| Infraestructura tecnológica | $100,000 - $500,000 |
Reconocimiento de marca fuerte y lealtad al cliente
La fortaleza de la marca de Williams-Sonoma es evidente en su desempeño financiero. En 2023, la compañía informó:
- Ingresos totales: $ 8.05 mil millones
- Ventas de comercio electrónico: 64.5% de los ingresos totales
- Tasa de retención de clientes: aproximadamente el 58%
Tecnología significativa e inversión de comercio electrónico
La inversión en tecnología es crucial para el posicionamiento competitivo. Williams-Sonoma asignó $ 189.3 millones a la tecnología y las capacidades digitales en el año fiscal 2023.
| Categoría de inversión tecnológica | Cantidad de gasto |
|---|---|
| Desarrollo de plataforma digital | $ 87.5 millones |
| Infraestructura de comercio electrónico | $ 62.8 millones |
| Ciberseguridad | $ 39 millones |
Cadena de suministro compleja y experiencia en fabricación
Williams-Sonoma mantiene una sofisticada cadena de suministro global con:
- Más de 70 socios de fabricación internacional
- Abastecimiento de más de 20 países
- Relación de rotación de inventario: 4.2 veces al año
Capacidades establecidas de diseño y comercialización
La experiencia en diseño de la compañía se refleja en sus múltiples marcas, incluidas:
- Williams Sonoma
- Granero de cerámica
- Olmo occidental
- Rejuvenecimiento
- Mark y Graham
Barreras a las métricas de entrada: Los nuevos participantes necesitarían replicar estas capacidades operativas complejas, que requieren recursos financieros y experiencia financieros sustanciales.
Williams-Sonoma, Inc. (WSM) - Porter's Five Forces: Competitive rivalry
You're analyzing Williams-Sonoma, Inc. (WSM) in a home retail space that remains intensely competitive. The rivalry here is definitely high, featuring large, established players like Wayfair and RH. Still, Williams-Sonoma, Inc. is showing it can execute a strategy that delivers superior profitability, even when facing these significant competitors.
The proof is in the numbers from the third quarter of 2025. Williams-Sonoma, Inc. posted an operating margin of 17.0% for Q3 2025. Honestly, this level of operating margin often outperforms most of its peers in the broader home goods sector, suggesting strong cost control or pricing power, or both.
This margin strength is directly tied to strategic choices. Management has been clear about prioritizing a shift toward full-price selling. This strategy is working to maintain margin expansion, even while navigating headwinds like new tariffs. For instance, the Gross Margin in Q3 2025 reached 46.1%, a 70 basis point increase year-over-year, driven by higher merchandise margins.
The company is not just holding steady on price; it's growing the top line, too. Comparable brand revenue for Q3 2025 grew 4%, which management points to as market outperformance. This growth was broad-based, with all brands showing positive comps for the fourth straight quarter.
Here's a quick look at how the key performance indicators stacked up in the third quarter of fiscal 2025:
| Metric | Q3 2025 Value | Comparison/Context |
|---|---|---|
| Comparable Brand Revenue Growth | 4% | Reiterated full-year guidance is 2% to 5%. |
| Operating Margin | 17.0% | Up 10 basis points year-over-year. |
| Raised Full-Year Operating Margin Guidance | 17.8% to 18.1% | Up from prior guidance range. |
| Net Revenue | $1.88 billion | Beat analyst estimates of $1.87 billion. |
| Diluted EPS | $1.96 | Grew 4.8% year-over-year. |
| Gross Margin | 46.1% | Up 70bps due to merchandise margins and supply chain efficiencies. |
The rivalry dynamic is also reflected in how different parts of the business are performing. You can see the strength in the Williams Sonoma brand specifically, which led the charge with a 7.3% comp. The B2B segment also expanded by 9% in the quarter, showing diversification in revenue streams that helps buffer direct consumer rivalry.
The company is clearly focused on operational efficiency to combat competitive pricing pressures. For example, the retail channel comp was strong at 8.5%, while e-commerce was up 1.9%. Furthermore, the announcement of a new $1 billion stock repurchase authorization shows management's confidence in generating cash flow, which is a powerful tool to deploy against rivals.
Here are the brand-specific comparable revenue results for Q3 2025:
- Williams Sonoma: 7.3% growth
- Pottery Barn Kids and Teen: 4.4% growth
- West Elm: 3.3% growth
- Pottery Barn: 1.3% growth
The company ended the quarter with $885 million in cash. This liquidity, combined with the margin discipline from strategies like increased full-price selling, positions Williams-Sonoma, Inc. to compete effectively, even if the housing market remains a headwind. Finance: draft a sensitivity analysis on the impact of a 100bps drop in gross margin on the new operating margin guidance by next Tuesday.
Williams-Sonoma, Inc. (WSM) - Porter's Five Forces: Threat of substitutes
You are looking at the pressure from alternatives to the premium home furnishings Williams-Sonoma, Inc. (WSM) offers. This force is significant because, honestly, a lot of what they sell-a table, a lamp, a set of dishes-can be sourced elsewhere, often for less.
The threat from cheaper, functional, non-branded home goods is high because the US home furnishings market is highly fragmented. Williams-Sonoma, Inc. is the largest omni-channel player, but they still capture no more than 5% of the total US home category, which is estimated at $300 billion. This means that for every dollar of revenue Williams-Sonoma, Inc. generates, there are at least 19 dollars being spent elsewhere in the US market on home goods, much of which is likely from smaller, less-branded competitors.
Consumers definitely have easy substitution options, especially with the growing acceptance of pre-owned goods driven by both cost and sustainability concerns. The US secondhand market was valued at about $56 billion as of 2025, marking a 14.3% increase from 2024. Specifically for home goods, the global second-hand homeware market was estimated at $31.4 billion in 2025. The furniture segment within that resale market alone generated $13.2 billion in revenue in 2024.
Here's a quick look at how the growth in the substitute market compares to Williams-Sonoma, Inc.'s recent performance. You see the scale difference, but also the momentum of alternatives:
| Metric | Williams-Sonoma, Inc. (WSM) Data (Q3 2025) | Substitute Market Data (Latest Available) |
|---|---|---|
| Comparable Brand Revenue Growth (YoY) | 4.0% | US Secondhand Market Growth (2024 to 2025): 14.3% |
| Market Position (US Specialty Home) | Largest omni-channel player (less than 5% share) | Secondhand Homeware Market Size (2025): $31.4 billion |
| Operating Margin | 17.0% (Q3 2025) | Secondhand Homeware Market CAGR (2025-2034): 5.5% |
Still, the housing market, which historically drives big-ticket furniture purchases, has been sluggish, which encourages consumers to delay major spending. The median sales price for houses sold in the U.S. in the first quarter of 2025 stood at $416,900. While mortgage rates eased to just above 6% from prior peaks above 7%, and home sales are forecasted to rise 9% in 2025, the immediate impact on large furniture orders was muted. For instance, new furniture orders dipped 3% in August 2025 compared to the prior year, and furniture shipments decreased by 6% between August 2024 and August 2025. Furniture is often a deferrable expense, so weakness in consumer confidence impacts spending willingness.
However, Williams-Sonoma, Inc. builds strong barriers against these substitutes through its focus on proprietary design and brand equity. The company emphasizes its in-house design capabilities and proprietary products that simply cannot be found elsewhere. This exclusivity, coupled with strong operational performance, helps maintain pricing power. You can see this reflected in their profitability metrics; the company boasts a Return on Equity (ROE) of 51.70% and a Return on Capital Employed (ROCE) of 106.64%. Furthermore, their market capitalization as of Q3 2025 was $21.62 billion, showing significant scale and brand value.
The key mitigating factors for Williams-Sonoma, Inc. against substitution are:
- Proprietary products designed and sold exclusively through their brands.
- Strong brand portfolio performance, with all brands showing positive comps in Q3 2025.
- High profitability metrics, like a 17.0% operating margin in Q3 2025.
- A new $1 billion stock repurchase authorization, signaling management confidence.
- The B2B segment expanded by 9% in Q3 2025.
Williams-Sonoma, Inc. (WSM) - Porter's Five Forces: Threat of new entrants
You're looking at the barriers to entry in the home furnishings space as of late 2025, and for Williams-Sonoma, Inc., the hurdles for a new competitor are substantial, largely due to the sheer scale of capital and infrastructure required.
The first major deterrent is the high capital investment necessary just to play the game, especially concerning inventory and logistics. New entrants must immediately commit massive amounts of cash to secure product flow. As of the third quarter of fiscal year 2025, Williams-Sonoma, Inc. held merchandise inventories valued at $1.5 billion. That's capital sitting on the balance sheet before a single sale is made. Furthermore, the company is guiding capital expenditures for the full fiscal year 2025 to be between $250 million and $275 million, with 85% of that spend earmarked for e-commerce, retail optimization, and supply chain efficiency. This signals that maintaining competitiveness requires continuous, heavy investment in the physical and digital backbone of the business.
The scale of the required omni-channel presence acts as a significant barrier. A new player can't just be online; they need physical touchpoints to build trust in high-consideration purchases like furniture. Williams-Sonoma, Inc. operates a mature, dual-platform system that is difficult to replicate quickly.
| Metric | Physical Footprint Data | Digital Footprint Data |
|---|---|---|
| Store Count (End of Q3 2025) | 513 locations | E-commerce Comp Growth (Q3 2025) of 1.9% |
| Channel Performance (Q3 2025 Comp) | Retail Channel Comp Growth of 8.5% | Net Revenues (Q3 2025) of $1.88 billion |
| Capital Allocation Focus (FY2025 Guidance) | Retail Optimization (part of CapEx) | E-commerce Channel (85% of CapEx) |
Then you have the brand equity barrier. Williams-Sonoma, Inc. doesn't just have one brand; it has a portfolio designed to capture different segments of the home market. This established portfolio is a massive hurdle for any newcomer trying to build trust from scratch. The key established brands include:
- Williams Sonoma
- Pottery Barn
- West Elm
- Pottery Barn Kids
- Pottery Barn Teen
- Rejuvenation
- Mark and Graham
- GreenRow
These brands serve a range of categories, aesthetics, and life stages, meaning a new entrant must successfully launch and scale multiple distinct identities simultaneously. For instance, Pottery Barn Kids and Teen delivered a Q3 2025 comparable brand revenue growth of 4.4%, showing the ongoing strength of those specific sub-brands.
Finally, the technology moat built through AI investment raises the bar for operational efficiency. Williams-Sonoma, Inc. is embedding AI across its operations, not just as a gimmick. They launched Olive, their AI culinary and shopping companion, and are scaling an AI-powered customer service assistant across all brands. The company anticipates it will be able to autonomously resolve more than 60% of chat inquiries using AI agents deployed via platforms like Salesforce's Agentforce 360. This focus on using AI to drive savings and offset headcount growth is defintely a differentiator in controlling operating costs. The ability to leverage proprietary data with this technology creates a sophisticated barrier that requires deep, integrated investment, not just off-the-shelf software.
Disclaimer
All information, articles, and product details provided on this website are for general informational and educational purposes only. We do not claim any ownership over, nor do we intend to infringe upon, any trademarks, copyrights, logos, brand names, or other intellectual property mentioned or depicted on this site. Such intellectual property remains the property of its respective owners, and any references here are made solely for identification or informational purposes, without implying any affiliation, endorsement, or partnership.
We make no representations or warranties, express or implied, regarding the accuracy, completeness, or suitability of any content or products presented. Nothing on this website should be construed as legal, tax, investment, financial, medical, or other professional advice. In addition, no part of this site—including articles or product references—constitutes a solicitation, recommendation, endorsement, advertisement, or offer to buy or sell any securities, franchises, or other financial instruments, particularly in jurisdictions where such activity would be unlawful.
All content is of a general nature and may not address the specific circumstances of any individual or entity. It is not a substitute for professional advice or services. Any actions you take based on the information provided here are strictly at your own risk. You accept full responsibility for any decisions or outcomes arising from your use of this website and agree to release us from any liability in connection with your use of, or reliance upon, the content or products found herein.