
|
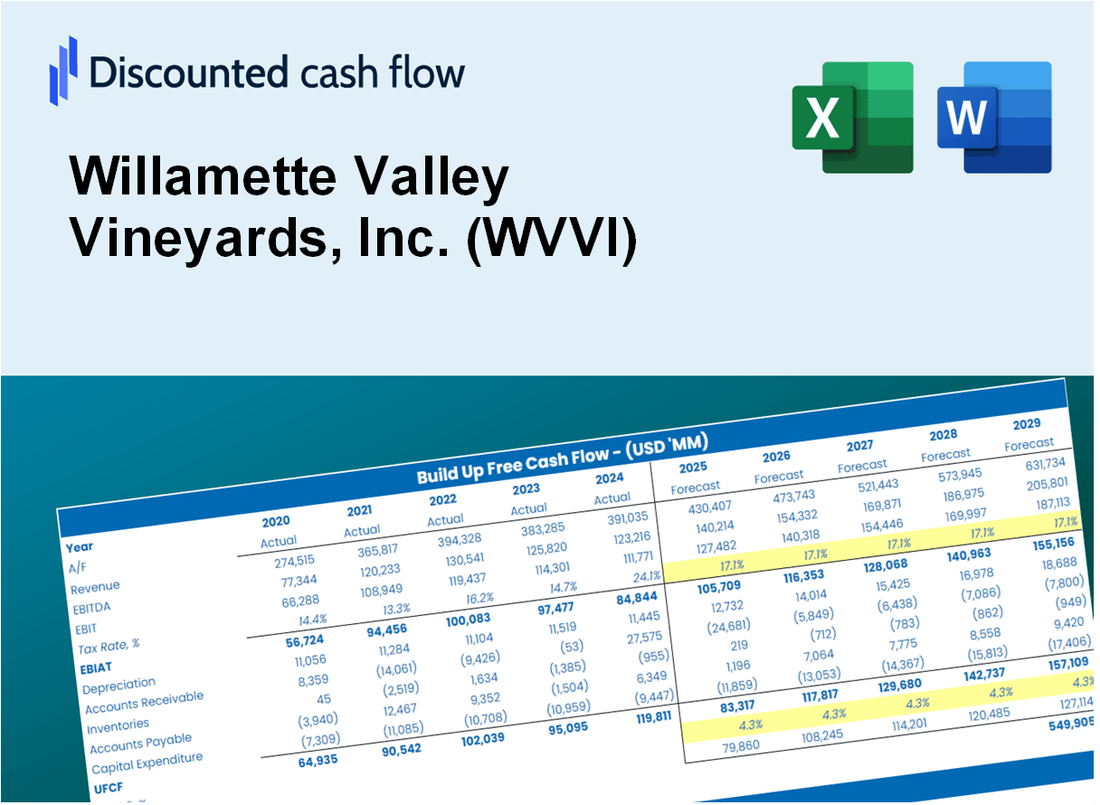
Valoración DCF de Willamette Valley Vineyards, Inc. (WVVI) |
Completamente Editable: Adáptelo A Sus Necesidades En Excel O Sheets
Diseño Profesional: Plantillas Confiables Y Estándares De La Industria
Predeterminadas Para Un Uso Rápido Y Eficiente
Compatible con MAC / PC, completamente desbloqueado
No Se Necesita Experiencia; Fáciles De Seguir
Willamette Valley Vineyards, Inc. (WVVI) Bundle
¡Explore el potencial financiero de Willamette Valley Vineyards, Inc. (WVVI) con nuestra calculadora DCF fácil de usar! Ingrese sus proyecciones para el crecimiento, los márgenes de beneficio y los gastos para calcular el valor intrínseco de Willamette Valley Vineyards, Inc. (WVVI) y refinar su enfoque de inversión.
What You Will Get
- Editable Excel Template: A fully customizable Excel-based DCF Calculator featuring pre-filled real WVVI financials.
- Real-World Data: Historical data and forward-looking estimates (as indicated in the yellow cells).
- Forecast Flexibility: Adjust forecast assumptions such as revenue growth, EBITDA %, and WACC.
- Automatic Calculations: Instantly observe the impact of your inputs on Willamette Valley Vineyards’ valuation.
- Professional Tool: Designed for investors, CFOs, consultants, and financial analysts.
- User-Friendly Design: Organized for clarity and ease of use, complete with step-by-step instructions.
Key Features
- 🍇 Real-Life WVVI Financials: Pre-filled historical and projected data for Willamette Valley Vineyards, Inc. (WVVI).
- ✏️ Fully Customizable Inputs: Adjust all critical parameters (yellow cells) like WACC, growth %, and tax rates.
- 📊 Professional DCF Valuation: Built-in formulas calculate Willamette Valley Vineyards' intrinsic value using the Discounted Cash Flow method.
- ⚡ Instant Results: Visualize Willamette Valley Vineyards' valuation instantly after making changes.
- Scenario Analysis: Test and compare outcomes for various financial assumptions side-by-side.
How It Works
- Download the Template: Get instant access to the Excel-based WVVI DCF Calculator.
- Input Your Assumptions: Adjust yellow-highlighted cells for growth rates, WACC, margins, and more.
- Instant Calculations: The model automatically updates Willamette Valley Vineyards' intrinsic value.
- Test Scenarios: Simulate different assumptions to evaluate potential valuation changes.
- Analyze and Decide: Use the results to guide your investment or financial analysis.
Why Choose Willamette Valley Vineyards, Inc. (WVVI)?
- Comprehensive Overview: Offers insights into vineyard management, production costs, and market trends in one platform.
- Customizable Features: Modify highlighted fields to explore different vineyard scenarios and outcomes.
- In-Depth Analysis: Automatically assesses the intrinsic value of Willamette Valley Vineyards and provides detailed financial projections.
- Preloaded Information: Historical harvest data and sales forecasts provide reliable benchmarks for decision-making.
- Expert Quality: Perfect for vineyard managers, investors, and agricultural consultants seeking reliable data.
Who Should Use This Product?
- Wine Enthusiasts: Gain insights into the quality and value of Willamette Valley Vineyards, Inc. (WVVI) wines.
- Investors: Make informed decisions about purchasing or trading shares of Willamette Valley Vineyards, Inc. (WVVI).
- Industry Analysts: Enhance market analysis with comprehensive data on Willamette Valley Vineyards, Inc. (WVVI).
- Restaurant Owners: Understand the market positioning of Willamette Valley Vineyards, Inc. (WVVI) to curate a competitive wine list.
- Students of Viticulture: Explore real-world applications of vineyard management and financial strategies through Willamette Valley Vineyards, Inc. (WVVI) case studies.
What the Template Contains
- Pre-Filled DCF Model: Willamette Valley Vineyards’ financial data preloaded for immediate use.
- WACC Calculator: Detailed calculations for Weighted Average Cost of Capital.
- Financial Ratios: Evaluate Willamette Valley Vineyards’ profitability, leverage, and efficiency.
- Editable Inputs: Change assumptions such as growth, margins, and CAPEX to fit your scenarios.
- Financial Statements: Annual and quarterly reports to support detailed analysis.
- Interactive Dashboard: Easily visualize key valuation metrics and results.
Disclaimer
All information, articles, and product details provided on this website are for general informational and educational purposes only. We do not claim any ownership over, nor do we intend to infringe upon, any trademarks, copyrights, logos, brand names, or other intellectual property mentioned or depicted on this site. Such intellectual property remains the property of its respective owners, and any references here are made solely for identification or informational purposes, without implying any affiliation, endorsement, or partnership.
We make no representations or warranties, express or implied, regarding the accuracy, completeness, or suitability of any content or products presented. Nothing on this website should be construed as legal, tax, investment, financial, medical, or other professional advice. In addition, no part of this site—including articles or product references—constitutes a solicitation, recommendation, endorsement, advertisement, or offer to buy or sell any securities, franchises, or other financial instruments, particularly in jurisdictions where such activity would be unlawful.
All content is of a general nature and may not address the specific circumstances of any individual or entity. It is not a substitute for professional advice or services. Any actions you take based on the information provided here are strictly at your own risk. You accept full responsibility for any decisions or outcomes arising from your use of this website and agree to release us from any liability in connection with your use of, or reliance upon, the content or products found herein.