
|
Yes Bank Limited (yesbank.ns) DCF Valoración |
Completamente Editable: Adáptelo A Sus Necesidades En Excel O Sheets
Diseño Profesional: Plantillas Confiables Y Estándares De La Industria
Predeterminadas Para Un Uso Rápido Y Eficiente
Compatible con MAC / PC, completamente desbloqueado
No Se Necesita Experiencia; Fáciles De Seguir
Yes Bank Limited (YESBANK.NS) Bundle
¡Mejore sus opciones de inversión con la calculadora DCF de YESBankns) DCF! Explore datos financieros auténticos, ajuste las predicciones y gastos de crecimiento, y observe instantáneamente cómo estas modificaciones influyen en el valor intrínseco de SÍ BANK.
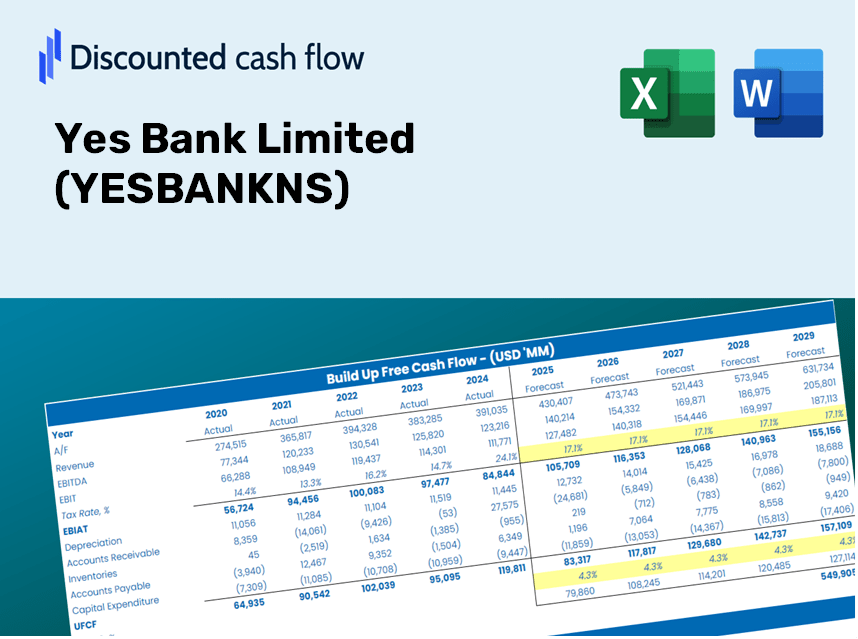
Discounted Cash Flow (DCF) - (USD MM)
| Year | AY1 2021 |
AY2 2022 |
AY3 2023 |
AY4 2024 |
AY5 2025 |
FY1 2026 |
FY2 2027 |
FY3 2028 |
FY4 2029 |
FY5 2030 |
|---|---|---|---|---|---|---|---|---|---|---|
| Revenue | 217,459.4 | 216,457.3 | 241,694.8 | 329,608.9 | 370,756.2 | 426,421.7 | 490,444.9 | 564,080.6 | 648,771.9 | 746,178.9 |
| Revenue Growth, % | 0 | -0.46083 | 11.66 | 36.37 | 12.48 | 15.01 | 15.01 | 15.01 | 15.01 | 15.01 |
| EBITDA | -31,289.0 | 14,673.9 | 14,147.5 | 20,832.4 | 37,173.3 | 12,443.7 | 14,312.0 | 16,460.8 | 18,932.2 | 21,774.7 |
| EBITDA, % | -14.39 | 6.78 | 5.85 | 6.32 | 10.03 | 2.92 | 2.92 | 2.92 | 2.92 | 2.92 |
| Depreciation | 3,600.3 | 4,033.3 | 4,334.2 | 5,455.5 | 4,933.9 | 7,077.0 | 8,139.5 | 9,361.6 | 10,767.2 | 12,383.8 |
| Depreciation, % | 1.66 | 1.86 | 1.79 | 1.66 | 1.33 | 1.66 | 1.66 | 1.66 | 1.66 | 1.66 |
| EBIT | -34,889.3 | 10,640.5 | 9,813.3 | 15,376.9 | 32,239.4 | 5,366.7 | 6,172.4 | 7,099.2 | 8,165.0 | 9,391.0 |
| EBIT, % | -16.04 | 4.92 | 4.06 | 4.67 | 8.7 | 1.26 | 1.26 | 1.26 | 1.26 | 1.26 |
| Total Cash | 119,292.5 | 28,284.9 | 193,560.1 | 634,057.0 | 285,672.6 | 277,225.7 | 318,848.5 | 366,720.5 | 421,780.2 | 485,106.5 |
| Total Cash, percent | .0 | .0 | .0 | .0 | .0 | .0 | .0 | .0 | .0 | .0 |
| Account Receivables | 38,343.4 | 49,908.1 | 49,407.7 | 64,589.1 | 82,909.4 | 87,919.1 | 101,119.3 | 116,301.4 | 133,763.0 | 153,846.2 |
| Account Receivables, % | 17.63 | 23.06 | 20.44 | 19.6 | 22.36 | 20.62 | 20.62 | 20.62 | 20.62 | 20.62 |
| Inventories | .0 | -535,511.5 | -265,774.1 | .0 | .0 | -170,568.7 | -196,178.0 | -225,632.2 | -259,508.8 | -298,471.6 |
| Inventories, % | 0 | -247.4 | -109.96 | 0 | 0 | -40 | -40 | -40 | -40 | -40 |
| Accounts Payable | 15,287.7 | 17,825.2 | 24,306.6 | 26,944.5 | 23,020.5 | 33,862.7 | 38,946.9 | 44,794.4 | 51,519.8 | 59,255.0 |
| Accounts Payable, % | 7.03 | 8.23 | 10.06 | 8.17 | 6.21 | 7.94 | 7.94 | 7.94 | 7.94 | 7.94 |
| Capital Expenditure | -2,696.0 | -4,102.8 | -7,915.9 | -9,806.6 | -7,417.4 | -9,710.6 | -11,168.6 | -12,845.4 | -14,774.1 | -16,992.3 |
| Capital Expenditure, % | -1.24 | -1.9 | -3.28 | -2.98 | -2 | -2.28 | -2.28 | -2.28 | -2.28 | -2.28 |
| Tax Rate, % | 24.11 | 24.11 | 24.11 | 24.11 | 24.11 | 24.11 | 24.11 | 24.11 | 24.11 | 24.11 |
| EBITAT | -34,889.3 | 7,897.2 | 7,358.2 | 12,852.0 | 24,464.9 | 4,386.3 | 5,044.9 | 5,802.4 | 6,673.5 | 7,675.5 |
| Depreciation | ||||||||||
| Changes in Account Receivables | ||||||||||
| Changes in Inventories | ||||||||||
| Changes in Accounts Payable | ||||||||||
| Capital Expenditure | ||||||||||
| UFCF | -57,040.7 | 534,312.1 | -258,979.2 | -269,816.7 | -262.8 | 178,153.9 | 19,509.1 | 22,438.2 | 25,807.1 | 29,681.7 |
| WACC, % | 17.81 | 13.89 | 14 | 15.31 | 14.14 | 15.03 | 15.03 | 15.03 | 15.03 | 15.03 |
| PV UFCF | ||||||||||
| SUM PV UFCF | 213,839.1 | |||||||||
| Long Term Growth Rate, % | 2.00 | |||||||||
| Free cash flow (T + 1) | 30,275 | |||||||||
| Terminal Value | 232,349 | |||||||||
| Present Terminal Value | 115,367 | |||||||||
| Enterprise Value | 329,206 | |||||||||
| Net Debt | 434,042 | |||||||||
| Equity Value | -104,836 | |||||||||
| Diluted Shares Outstanding, MM | 31,365 | |||||||||
| Equity Value Per Share | -3.34 |
What You Will Receive
- Comprehensive YESBANKNS Financials: Access to historical and projected data for precise valuation.
- Customizable Variables: Adjust WACC, tax rates, revenue growth, and capital expenditures according to your needs.
- Instant Calculations: Intrinsic value and NPV are computed automatically in real-time.
- Scenario Simulation: Evaluate various scenarios to assess YES Bank’s potential future outcomes.
- User-Friendly Interface: Designed for professionals but easy to use for newcomers.
Key Features
- Customizable Forecast Parameters: Adjust vital inputs such as revenue growth, EBITDA %, and capital expenditures.
- Instant DCF Valuation: Automatically computes intrinsic value, NPV, and other key metrics in real-time.
- High-Precision Accuracy: Leverages Yes Bank Limited's (YESBANKNS) real financial data for dependable valuation results.
- Effortless Scenario Analysis: Easily explore different assumptions and compare various outcomes.
- Efficiency Booster: Remove the hassle of constructing intricate valuation models from the ground up.
How It Functions
- Download the Template: Gain immediate access to the Excel-based YESBANK DCF Calculator.
- Input Your Assumptions: Modify the yellow-highlighted cells for growth rates, WACC, profit margins, and more.
- Instant Calculations: The model will automatically refresh YES Bank's intrinsic value.
- Test Scenarios: Experiment with various assumptions to analyze potential valuation shifts.
- Analyze and Decide: Leverage the results to inform your investment or financial evaluation.
Why Opt for This Calculator?
- All-in-One Tool: Features DCF, WACC, and a range of financial ratio analyses seamlessly integrated.
- Flexible Inputs: Use the yellow-highlighted cells to modify parameters and explore different scenarios.
- In-Depth Analysis: Automatically computes the intrinsic value and Net Present Value for Yes Bank Limited (YESBANKNS).
- Preloaded Information: Comes with historical and projected data for reliable baseline assessments.
- Professional Standard: Perfect for financial analysts, investors, and business consultants alike.
Who Can Benefit from This Product?
- Institutional Investors: Create comprehensive and accurate valuation models for portfolio assessment of Yes Bank Limited (YESBANKNS).
- Corporate Finance Teams: Evaluate valuation scenarios to inform and enhance strategic planning.
- Consultants and Financial Advisors: Deliver precise valuation insights to clients investing in Yes Bank Limited (YESBANKNS).
- Students and Educators: Utilize real-world data for practical applications in financial modeling and education.
- Finance Enthusiasts: Gain insights into the valuation processes of banking institutions like Yes Bank Limited (YESBANKNS).
Components of the Template
- Historical Data: Contains Yes Bank's past financial performance and foundational forecasts.
- DCF and Levered DCF Models: Comprehensive templates for assessing Yes Bank's intrinsic value.
- WACC Sheet: Pre-configured calculations for the Weighted Average Cost of Capital.
- Editable Inputs: Adjust key variables such as growth rates, EBITDA %, and CAPEX assumptions.
- Quarterly and Annual Statements: A thorough analysis of Yes Bank's financials.
- Interactive Dashboard: Dynamically visualize valuation outcomes and forecasts.
Disclaimer
All information, articles, and product details provided on this website are for general informational and educational purposes only. We do not claim any ownership over, nor do we intend to infringe upon, any trademarks, copyrights, logos, brand names, or other intellectual property mentioned or depicted on this site. Such intellectual property remains the property of its respective owners, and any references here are made solely for identification or informational purposes, without implying any affiliation, endorsement, or partnership.
We make no representations or warranties, express or implied, regarding the accuracy, completeness, or suitability of any content or products presented. Nothing on this website should be construed as legal, tax, investment, financial, medical, or other professional advice. In addition, no part of this site—including articles or product references—constitutes a solicitation, recommendation, endorsement, advertisement, or offer to buy or sell any securities, franchises, or other financial instruments, particularly in jurisdictions where such activity would be unlawful.
All content is of a general nature and may not address the specific circumstances of any individual or entity. It is not a substitute for professional advice or services. Any actions you take based on the information provided here are strictly at your own risk. You accept full responsibility for any decisions or outcomes arising from your use of this website and agree to release us from any liability in connection with your use of, or reliance upon, the content or products found herein.