
|
Valoración DCF de Zeta Global Holdings Corp. (ZETA) |
Completamente Editable: Adáptelo A Sus Necesidades En Excel O Sheets
Diseño Profesional: Plantillas Confiables Y Estándares De La Industria
Predeterminadas Para Un Uso Rápido Y Eficiente
Compatible con MAC / PC, completamente desbloqueado
No Se Necesita Experiencia; Fáciles De Seguir
Zeta Global Holdings Corp. (ZETA) Bundle
¡Agilice su análisis y mejore la precisión con nuestra calculadora DCF (ZETA)! Equipado con datos actualizados de Zeta Global Holdings Corp. y suposiciones personalizables, esta herramienta le permite pronosticar, evaluar y evaluar (ZETA) como un inversor experimentado.
What You Will Get
- Real Zeta Data: Preloaded financials – from revenue to EBIT – based on actual and projected figures for Zeta Global Holdings Corp. (ZETA).
- Full Customization: Adjust all critical parameters (yellow cells) like WACC, growth %, and tax rates specific to Zeta Global Holdings Corp. (ZETA).
- Instant Valuation Updates: Automatic recalculations to analyze the impact of changes on Zeta Global Holdings Corp. (ZETA)’s fair value.
- Versatile Excel Template: Tailored for quick edits, scenario testing, and detailed projections for Zeta Global Holdings Corp. (ZETA).
- Time-Saving and Accurate: Skip building models from scratch while maintaining precision and flexibility for Zeta Global Holdings Corp. (ZETA).
Key Features
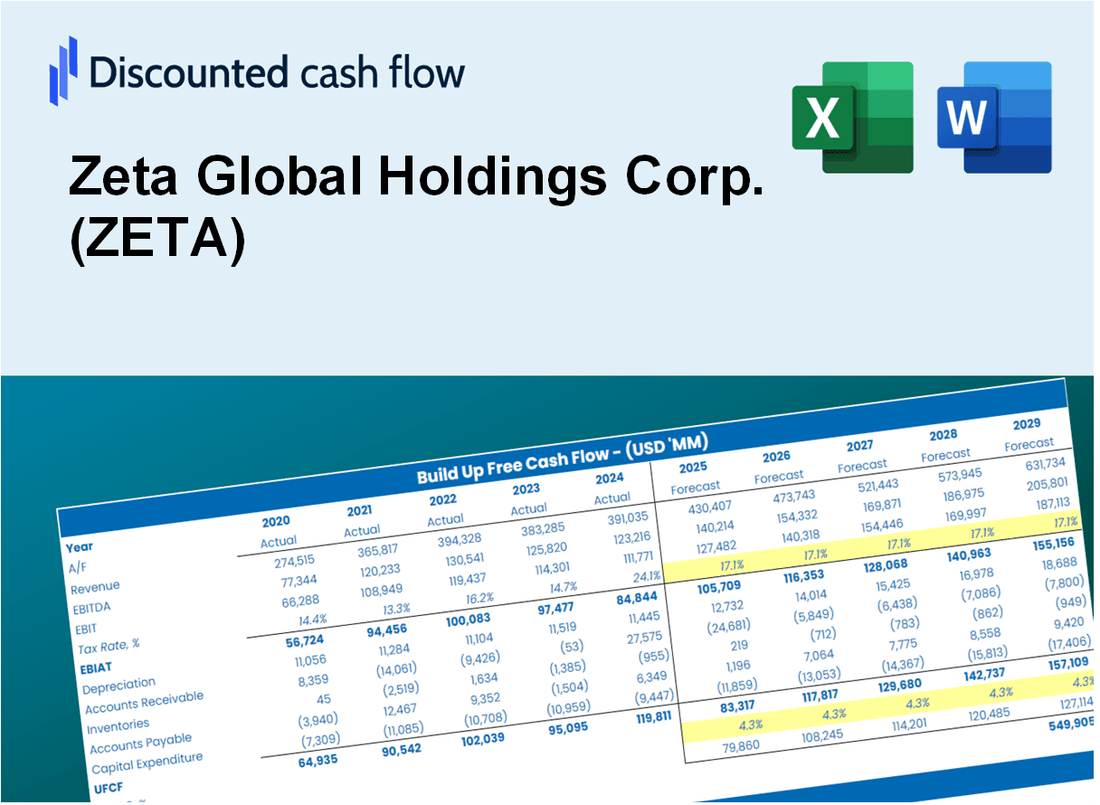
- Comprehensive Historical Data: Zeta Global's financial statements and pre-filled projections.
- Customizable Parameters: Adjust WACC, tax rates, revenue growth, and EBITDA margins to fit your analysis.
- Real-Time Valuation: Observe Zeta Global's intrinsic value update instantly.
- Intuitive Visualizations: Dashboard graphs illustrate valuation outcomes and essential metrics.
- Designed for Precision: A reliable tool tailored for analysts, investors, and finance professionals.
How It Works
- Step 1: Download the Excel file.
- Step 2: Review Zeta Global Holdings Corp.'s pre-filled financial data and forecasts.
- Step 3: Modify key inputs such as revenue growth, WACC, and tax rates (highlighted cells).
- Step 4: Watch the DCF model update in real-time as you adjust your assumptions.
- Step 5: Analyze the outputs and leverage the results for your investment decisions.
Why Choose This Calculator for Zeta Global Holdings Corp. (ZETA)?
- User-Friendly Interface: Tailored for both novice and seasoned users.
- Customizable Inputs: Adjust parameters easily to suit your analysis needs.
- Real-Time Feedback: Observe immediate changes in Zeta's valuation as you tweak inputs.
- Preloaded Financial Data: Comes equipped with Zeta’s actual financial metrics for swift evaluations.
- Relied Upon by Experts: Favored by investors and analysts for making well-informed choices.
Who Should Use This Product?
- Finance Students: Understand advanced marketing analytics and apply them using real-world data.
- Academics: Integrate cutting-edge marketing models into your research or teaching materials.
- Investors: Evaluate your investment strategies and analyze the market performance of Zeta Global Holdings Corp. (ZETA).
- Analysts: Enhance your analysis process with a customizable framework tailored for marketing insights.
- Marketing Professionals: Discover how major companies like Zeta Global are leveraging data for strategic decisions.
What the Template Contains
- Operating and Balance Sheet Data: Pre-filled Zeta Global Holdings Corp. (ZETA) historical data and forecasts, including revenue, EBITDA, EBIT, and capital expenditures.
- WACC Calculation: A dedicated sheet for Weighted Average Cost of Capital (WACC), including parameters like Beta, risk-free rate, and share price.
- DCF Valuation (Unlevered and Levered): Editable Discounted Cash Flow models showing intrinsic value with detailed calculations.
- Financial Statements: Pre-loaded financial statements (annual and quarterly) to support analysis.
- Key Ratios: Includes profitability, leverage, and efficiency ratios for Zeta Global Holdings Corp. (ZETA).
- Dashboard and Charts: Visual summary of valuation outputs and assumptions to analyze results easily.
Disclaimer
All information, articles, and product details provided on this website are for general informational and educational purposes only. We do not claim any ownership over, nor do we intend to infringe upon, any trademarks, copyrights, logos, brand names, or other intellectual property mentioned or depicted on this site. Such intellectual property remains the property of its respective owners, and any references here are made solely for identification or informational purposes, without implying any affiliation, endorsement, or partnership.
We make no representations or warranties, express or implied, regarding the accuracy, completeness, or suitability of any content or products presented. Nothing on this website should be construed as legal, tax, investment, financial, medical, or other professional advice. In addition, no part of this site—including articles or product references—constitutes a solicitation, recommendation, endorsement, advertisement, or offer to buy or sell any securities, franchises, or other financial instruments, particularly in jurisdictions where such activity would be unlawful.
All content is of a general nature and may not address the specific circumstances of any individual or entity. It is not a substitute for professional advice or services. Any actions you take based on the information provided here are strictly at your own risk. You accept full responsibility for any decisions or outcomes arising from your use of this website and agree to release us from any liability in connection with your use of, or reliance upon, the content or products found herein.