
|
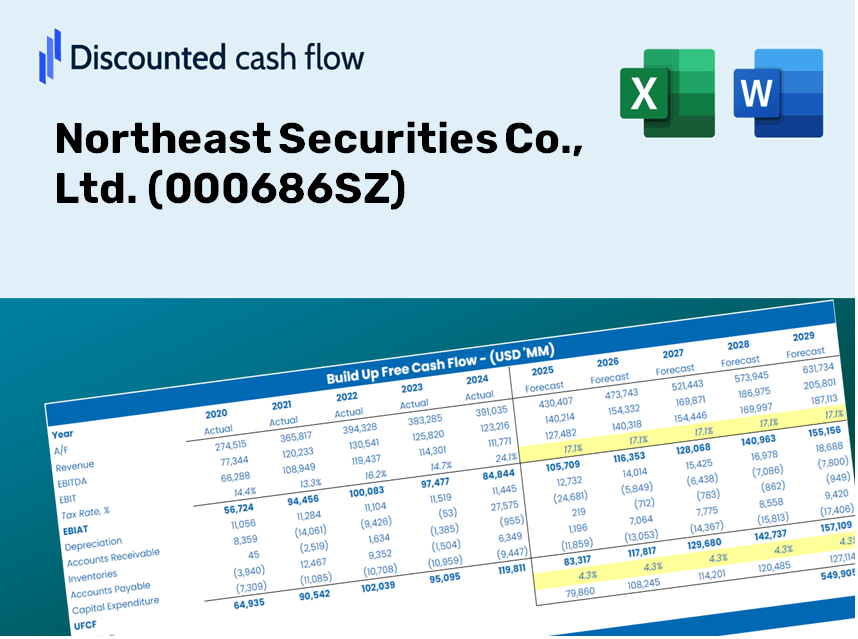
Northeast Securities Co., Ltd. (000686.sz) Valeure DCF |
Entièrement Modifiable: Adapté À Vos Besoins Dans Excel Ou Sheets
Conception Professionnelle: Modèles Fiables Et Conformes Aux Normes Du Secteur
Pré-Construits Pour Une Utilisation Rapide Et Efficace
Compatible MAC/PC, entièrement débloqué
Aucune Expertise N'Est Requise; Facile À Suivre
Northeast Securities Co., Ltd. (000686.SZ) Bundle
Prenez en charge votre analyse d'évaluation de votre évaluation Northeast Securities Co., Ltd. (000686SZ) avec notre calculatrice sophistiquée DCF! Préchargé avec des données réelles (000686SZ), ce modèle Excel vous permet d'ajuster les prévisions et les hypothèses pour déterminer avec précision la valeur intrinsèque de Northeast Securities Co., Ltd.
Discounted Cash Flow (DCF) - (USD MM)
| Year | AY1 2020 |
AY2 2021 |
AY3 2022 |
AY4 2023 |
AY5 2024 |
FY1 2025 |
FY2 2026 |
FY3 2027 |
FY4 2028 |
FY5 2029 |
|---|---|---|---|---|---|---|---|---|---|---|
| Revenue | 6,467.5 | 7,306.0 | 4,899.5 | 6,384.3 | 6,405.5 | 6,576.2 | 6,751.5 | 6,931.5 | 7,116.2 | 7,305.9 |
| Revenue Growth, % | 0 | 12.96 | -32.94 | 30.31 | 0.33105 | 2.67 | 2.67 | 2.67 | 2.67 | 2.67 |
| EBITDA | .0 | .0 | .0 | .0 | .0 | .0 | .0 | .0 | .0 | .0 |
| EBITDA, % | 0 | 0 | 0 | -0.0000000102 | 0 | -0.00000000204 | -0.00000000204 | -0.00000000204 | -0.00000000204 | -0.00000000204 |
| Depreciation | 3,025.5 | 3,835.3 | 3,602.5 | 254.8 | 265.6 | 2,379.8 | 2,443.2 | 2,508.4 | 2,575.2 | 2,643.9 |
| Depreciation, % | 46.78 | 52.49 | 73.53 | 3.99 | 4.15 | 36.19 | 36.19 | 36.19 | 36.19 | 36.19 |
| EBIT | -3,025.5 | -3,835.3 | -3,602.5 | -254.8 | -265.6 | -2,379.8 | -2,443.2 | -2,508.4 | -2,575.2 | -2,643.9 |
| EBIT, % | -46.78 | -52.49 | -73.53 | -3.99 | -4.15 | -36.19 | -36.19 | -36.19 | -36.19 | -36.19 |
| Total Cash | 34,893.3 | 40,231.0 | 40,372.2 | 4,554.0 | 49,994.1 | 6,199.1 | 6,364.4 | 6,534.0 | 6,708.2 | 6,887.0 |
| Total Cash, percent | .0 | .0 | .0 | .0 | .0 | .0 | .0 | .0 | .0 | .0 |
| Account Receivables | 15,671.4 | 297.2 | 16,186.6 | 17,360.5 | 21,081.8 | 5,314.5 | 5,456.1 | 5,601.6 | 5,750.9 | 5,904.2 |
| Account Receivables, % | 242.31 | 4.07 | 330.37 | 271.92 | 329.12 | 80.81 | 80.81 | 80.81 | 80.81 | 80.81 |
| Inventories | 107.0 | 98.4 | 307.7 | .0 | .0 | 122.1 | 125.3 | 128.7 | 132.1 | 135.6 |
| Inventories, % | 1.65 | 1.35 | 6.28 | 0 | 0 | 1.86 | 1.86 | 1.86 | 1.86 | 1.86 |
| Accounts Payable | 269.1 | 763.2 | 1,338.2 | 936.2 | 646.4 | 876.9 | 900.3 | 924.3 | 948.9 | 974.2 |
| Accounts Payable, % | 4.16 | 10.45 | 27.31 | 14.66 | 10.09 | 13.33 | 13.33 | 13.33 | 13.33 | 13.33 |
| Capital Expenditure | -132.9 | -214.3 | -270.7 | -294.4 | -179.6 | -235.8 | -242.1 | -248.5 | -255.2 | -262.0 |
| Capital Expenditure, % | -2.06 | -2.93 | -5.53 | -4.61 | -2.8 | -3.59 | -3.59 | -3.59 | -3.59 | -3.59 |
| Tax Rate, % | 24.96 | 24.96 | 24.96 | 24.96 | 24.96 | 24.96 | 24.96 | 24.96 | 24.96 | 24.96 |
| EBITAT | -2,231.8 | -2,974.9 | -4,152.1 | -235.7 | -199.3 | -1,993.6 | -2,046.7 | -2,101.3 | -2,157.3 | -2,214.8 |
| Depreciation | ||||||||||
| Changes in Account Receivables | ||||||||||
| Changes in Inventories | ||||||||||
| Changes in Accounts Payable | ||||||||||
| Capital Expenditure | ||||||||||
| UFCF | -14,848.6 | 16,523.0 | -16,344.1 | -1,543.3 | -4,124.3 | 16,026.2 | 32.9 | 33.8 | 34.7 | 35.6 |
| WACC, % | 4.28 | 4.37 | 4.9 | 4.73 | 4.31 | 4.52 | 4.52 | 4.52 | 4.52 | 4.52 |
| PV UFCF | ||||||||||
| SUM PV UFCF | 15,450.5 | |||||||||
| Long Term Growth Rate, % | 2.00 | |||||||||
| Free cash flow (T + 1) | 36 | |||||||||
| Terminal Value | 1,442 | |||||||||
| Present Terminal Value | 1,156 | |||||||||
| Enterprise Value | 16,606 | |||||||||
| Net Debt | -49,994 | |||||||||
| Equity Value | 66,600 | |||||||||
| Diluted Shares Outstanding, MM | 2,361 | |||||||||
| Equity Value Per Share | 28.21 |
Benefits You Will Enjoy
- Comprehensive Financial Model: Leverage Northeast Securities Co., Ltd.’s (000686SZ) actual data for accurate DCF valuation.
- Complete Forecast Control: Modify revenue growth, profit margins, WACC, and other essential factors to fit your analysis.
- Real-Time Calculations: Immediate updates ensure you can view results instantly as adjustments are made.
- Professional-Grade Template: A polished Excel workbook crafted for high-level valuation needs.
- Flexible and Reusable: Designed for adaptability, allowing you to utilize it repeatedly for in-depth forecasts.
Key Features
- Comprehensive Data: Access Northeast Securities Co., Ltd.'s (000686SZ) historical financial reports and pre-populated projections.
- Customizable Inputs: Adjust WACC, tax rates, revenue growth, and EBITDA margins to suit your analysis.
- Real-Time Analysis: Instantly view the recalculated intrinsic value for Northeast Securities Co., Ltd. (000686SZ).
- Visual Insights: Interactive dashboard charts present valuation results and critical performance indicators.
- Designed for Precision: A robust tool tailored for analysts, investors, and finance professionals.
How It Operates
- Download the Template: Gain immediate access to the Excel-based Northeast Securities DCF Calculator.
- Input Your Assumptions: Modify the yellow-highlighted cells with your growth rates, WACC, margins, and additional variables.
- Instant Calculations: The model automatically recalculates the intrinsic value for Northeast Securities (000686SZ).
- Test Scenarios: Experiment with various assumptions to see how they impact valuation outcomes.
- Analyze and Decide: Utilize the outcomes to inform your investment strategies or financial assessments.
Why Choose Northeast Securities Co., Ltd. (000686SZ)?
- User-Friendly Interface: Tailored for both novice and experienced users.
- Customizable Inputs: Adjust variables effortlessly to suit your financial analysis.
- Real-Time Insights: Witness immediate changes in the valuation of Northeast Securities as you modify inputs.
- Pre-Loaded Data: Comes equipped with actual financial metrics for swift evaluations.
- Endorsed by Experts: Favored by investors and analysts for making well-informed financial decisions.
Who Can Benefit from This Product?
- Investors: Effectively evaluate the fair value of Northeast Securities Co., Ltd. (000686SZ) before making investment choices.
- CFOs: Utilize a high-quality DCF model for accurate financial reporting and analysis.
- Consultants: Seamlessly modify the template for client valuation reports.
- Entrepreneurs: Acquire knowledge of financial modeling practices employed by major corporations.
- Educators: Implement it as a resource for illustrating valuation techniques in the classroom.
Contents of the Template
- Preloaded NE Securities Data: Historical and projected financial information, including revenue, EBIT, and capital expenditures.
- DCF and WACC Models: High-quality sheets designed for calculating intrinsic value and Weighted Average Cost of Capital.
- Customizable Inputs: Yellow-highlighted cells for modifying revenue growth, tax rates, and discount rates.
- Financial Statements: Detailed annual and quarterly financial reports for in-depth analysis.
- Key Ratios: Ratios related to profitability, leverage, and efficiency for performance evaluation.
- Dashboard and Charts: Visual representations of valuation outcomes and underlying assumptions.
Disclaimer
All information, articles, and product details provided on this website are for general informational and educational purposes only. We do not claim any ownership over, nor do we intend to infringe upon, any trademarks, copyrights, logos, brand names, or other intellectual property mentioned or depicted on this site. Such intellectual property remains the property of its respective owners, and any references here are made solely for identification or informational purposes, without implying any affiliation, endorsement, or partnership.
We make no representations or warranties, express or implied, regarding the accuracy, completeness, or suitability of any content or products presented. Nothing on this website should be construed as legal, tax, investment, financial, medical, or other professional advice. In addition, no part of this site—including articles or product references—constitutes a solicitation, recommendation, endorsement, advertisement, or offer to buy or sell any securities, franchises, or other financial instruments, particularly in jurisdictions where such activity would be unlawful.
All content is of a general nature and may not address the specific circumstances of any individual or entity. It is not a substitute for professional advice or services. Any actions you take based on the information provided here are strictly at your own risk. You accept full responsibility for any decisions or outcomes arising from your use of this website and agree to release us from any liability in connection with your use of, or reliance upon, the content or products found herein.