
|
37 Interactive Entertainment Network Technology Group Co., Ltd. (002555.SZ) Évaluation DCF |
Entièrement Modifiable: Adapté À Vos Besoins Dans Excel Ou Sheets
Conception Professionnelle: Modèles Fiables Et Conformes Aux Normes Du Secteur
Pré-Construits Pour Une Utilisation Rapide Et Efficace
Compatible MAC/PC, entièrement débloqué
Aucune Expertise N'Est Requise; Facile À Suivre
37 Interactive Entertainment Network Technology Group Co., Ltd. (002555.SZ) Bundle
Rationalisez votre analyse et améliorez la précision avec notre calculatrice [symbole] DCF! En utilisant des données réelles de 37 Interactive Entertainment Network Technology Group Co., Ltd. (002555SZ) et des hypothèses personnalisables, cet outil vous permet de prévoir, analyser et valoriser [la société] comme un investisseur chevronné.
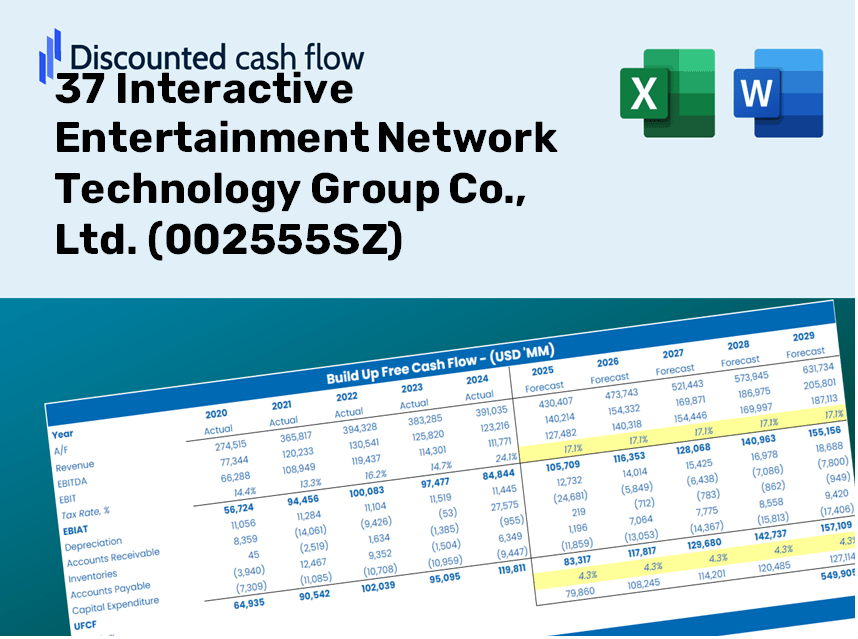
Discounted Cash Flow (DCF) - (USD MM)
| Year | AY1 2020 |
AY2 2021 |
AY3 2022 |
AY4 2023 |
AY5 2024 |
FY1 2025 |
FY2 2026 |
FY3 2027 |
FY4 2028 |
FY5 2029 |
|---|---|---|---|---|---|---|---|---|---|---|
| Revenue | 14,399.7 | 16,216.5 | 16,406.0 | 16,546.9 | 17,441.0 | 19,458.6 | 21,709.6 | 24,221.0 | 27,022.9 | 30,149.0 |
| Revenue Growth, % | 0 | 12.62 | 1.17 | 0.85845 | 5.4 | 11.57 | 11.57 | 11.57 | 11.57 | 11.57 |
| EBITDA | 3,044.5 | 3,054.1 | 3,336.4 | 2,844.0 | 2,902.0 | 3,663.6 | 4,087.4 | 4,560.3 | 5,087.8 | 5,676.4 |
| EBITDA, % | 21.14 | 18.83 | 20.34 | 17.19 | 16.64 | 18.83 | 18.83 | 18.83 | 18.83 | 18.83 |
| Depreciation | 66.0 | 87.0 | 87.0 | 79.8 | 88.5 | 97.9 | 109.2 | 121.8 | 135.9 | 151.6 |
| Depreciation, % | 0.45836 | 0.53664 | 0.53002 | 0.48241 | 0.50756 | 0.50299 | 0.50299 | 0.50299 | 0.50299 | 0.50299 |
| EBIT | 2,978.5 | 2,967.1 | 3,249.4 | 2,764.2 | 2,813.4 | 3,565.8 | 3,978.2 | 4,438.5 | 4,951.9 | 5,524.8 |
| EBIT, % | 20.68 | 18.3 | 19.81 | 16.71 | 16.13 | 18.32 | 18.32 | 18.32 | 18.32 | 18.32 |
| Total Cash | 3,098.1 | 6,717.1 | 8,148.2 | 8,201.7 | 7,308.3 | 7,941.9 | 8,860.6 | 9,885.6 | 11,029.2 | 12,305.1 |
| Total Cash, percent | .0 | .0 | .0 | .0 | .0 | .0 | .0 | .0 | .0 | .0 |
| Account Receivables | 1,249.8 | 1,414.5 | 1,562.6 | 1,592.7 | 1,255.5 | 1,702.6 | 1,899.6 | 2,119.3 | 2,364.5 | 2,638.0 |
| Account Receivables, % | 8.68 | 8.72 | 9.52 | 9.63 | 7.2 | 8.75 | 8.75 | 8.75 | 8.75 | 8.75 |
| Inventories | .0 | .0 | .0 | .0 | .0 | .0 | .0 | .0 | .0 | .0 |
| Inventories, % | 0 | 0 | 0 | 0 | 0 | 0 | 0 | 0 | 0 | 0 |
| Accounts Payable | 1,471.4 | 1,773.0 | 2,203.6 | 2,912.7 | 1,024.9 | 2,259.6 | 2,521.0 | 2,812.7 | 3,138.0 | 3,501.1 |
| Accounts Payable, % | 10.22 | 10.93 | 13.43 | 17.6 | 5.88 | 11.61 | 11.61 | 11.61 | 11.61 | 11.61 |
| Capital Expenditure | -1,071.7 | -341.7 | -320.0 | -1,312.0 | -572.3 | -883.8 | -986.0 | -1,100.1 | -1,227.4 | -1,369.4 |
| Capital Expenditure, % | -7.44 | -2.11 | -1.95 | -7.93 | -3.28 | -4.54 | -4.54 | -4.54 | -4.54 | -4.54 |
| Tax Rate, % | 13.46 | 13.46 | 13.46 | 13.46 | 13.46 | 13.46 | 13.46 | 13.46 | 13.46 | 13.46 |
| EBITAT | 2,531.1 | 2,626.5 | 2,907.7 | 2,411.1 | 2,434.7 | 3,114.7 | 3,475.0 | 3,877.0 | 4,325.5 | 4,825.9 |
| Depreciation | ||||||||||
| Changes in Account Receivables | ||||||||||
| Changes in Inventories | ||||||||||
| Changes in Accounts Payable | ||||||||||
| Capital Expenditure | ||||||||||
| UFCF | 1,747.1 | 2,508.8 | 2,957.2 | 1,858.0 | 400.4 | 3,116.4 | 2,662.6 | 2,970.6 | 3,314.3 | 3,697.7 |
| WACC, % | 8.8 | 8.81 | 8.81 | 8.8 | 8.8 | 8.8 | 8.8 | 8.8 | 8.8 | 8.8 |
| PV UFCF | ||||||||||
| SUM PV UFCF | 12,209.8 | |||||||||
| Long Term Growth Rate, % | 3.00 | |||||||||
| Free cash flow (T + 1) | 3,809 | |||||||||
| Terminal Value | 65,635 | |||||||||
| Present Terminal Value | 43,046 | |||||||||
| Enterprise Value | 55,256 | |||||||||
| Net Debt | -2,404 | |||||||||
| Equity Value | 57,660 | |||||||||
| Diluted Shares Outstanding, MM | 2,200 | |||||||||
| Equity Value Per Share | 26.21 |
What You Will Receive
- Authentic (002555SZ) Financial Data: Pre-loaded with 37 Interactive Entertainment Network Technology Group's historical and projected figures for accurate analysis.
- Completely Customizable Template: Easily adjust essential inputs such as revenue growth, WACC, and EBITDA percentage.
- Instant Calculations: Watch as the intrinsic value of (002555SZ) updates in real-time with your modifications.
- Comprehensive Valuation Tool: Tailored for investors, analysts, and consultants aiming for precise DCF outcomes.
- Intuitive Layout: Clear design and straightforward instructions suitable for users of all skill levels.
Key Features
- 🔍 Real-Life 37 Interactive Financials: Pre-filled historical and projected data for 37 Interactive Entertainment Network Technology Group Co., Ltd. (002555SZ).
- ✏️ Fully Customizable Inputs: Adjust all essential parameters (yellow cells) such as WACC, growth %, and tax rates.
- 📊 Professional DCF Valuation: Integrated formulas calculate the intrinsic value of 37 Interactive using the Discounted Cash Flow method.
- ⚡ Instant Results: Visualize the valuation of 37 Interactive immediately after making adjustments.
- Scenario Analysis: Evaluate and compare outcomes for different financial assumptions side-by-side.
How It Works
- Step 1: Download the Excel file.
- Step 2: Review the pre-filled financial data and forecasts for 37 Interactive Entertainment Network Technology Group Co., Ltd. (002555SZ).
- Step 3: Adjust key inputs such as revenue growth, WACC, and tax rates (highlighted cells).
- Step 4: Observe the DCF model refresh in real-time as you modify your assumptions.
- Step 5: Evaluate the outputs and utilize the results for informed investment decisions.
Why Choose This Calculator for 37 Interactive Entertainment Network Technology Group Co., Ltd. (002555SZ)?
- User-Friendly Interface: Suitable for both novices and seasoned users.
- Customizable Inputs: Effortlessly adjust variables to fit your analysis needs.
- Real-Time Adjustments: Instantly observe changes in 37 Interactive’s valuation as you tweak inputs.
- Preloaded Financials: Comes ready with 37 Interactive’s actual financial data for swift analysis.
- Preferred by Experts: Utilized by investors and analysts for making well-informed decisions.
Who Can Benefit from This Product?
- Finance Students: Understand valuation methods and apply them using actual market data for 37 Interactive Entertainment (002555SZ).
- Academics: Integrate industry-standard models into your teaching or research focused on 37 Interactive Entertainment (002555SZ).
- Investors: Evaluate your own hypotheses and investigate valuation results for 37 Interactive Entertainment (002555SZ).
- Analysts: Enhance your efficiency with an adaptable, ready-to-use DCF model tailored for 37 Interactive Entertainment (002555SZ).
- Small Business Owners: Discover how major companies like 37 Interactive Entertainment (002555SZ) are analyzed in the market.
Contents of the Template
- Preloaded 37 Interactive Entertainment Data: Historical and projected financial figures, including revenue, EBIT, and capital expenditures.
- DCF and WACC Models: High-quality spreadsheets designed for calculating intrinsic value and Weighted Average Cost of Capital.
- Editable Inputs: Yellow-highlighted cells for modifying revenue growth, tax rates, and discount rates.
- Financial Statements: Detailed annual and quarterly financial reports for in-depth analysis.
- Key Ratios: Metrics for profitability, leverage, and efficiency to assess overall performance.
- Dashboard and Charts: Visual representations of valuation results and underlying assumptions.
Disclaimer
All information, articles, and product details provided on this website are for general informational and educational purposes only. We do not claim any ownership over, nor do we intend to infringe upon, any trademarks, copyrights, logos, brand names, or other intellectual property mentioned or depicted on this site. Such intellectual property remains the property of its respective owners, and any references here are made solely for identification or informational purposes, without implying any affiliation, endorsement, or partnership.
We make no representations or warranties, express or implied, regarding the accuracy, completeness, or suitability of any content or products presented. Nothing on this website should be construed as legal, tax, investment, financial, medical, or other professional advice. In addition, no part of this site—including articles or product references—constitutes a solicitation, recommendation, endorsement, advertisement, or offer to buy or sell any securities, franchises, or other financial instruments, particularly in jurisdictions where such activity would be unlawful.
All content is of a general nature and may not address the specific circumstances of any individual or entity. It is not a substitute for professional advice or services. Any actions you take based on the information provided here are strictly at your own risk. You accept full responsibility for any decisions or outcomes arising from your use of this website and agree to release us from any liability in connection with your use of, or reliance upon, the content or products found herein.