
|
Jinlongyu Group Co., Ltd. (002882.sz) Valation DCF |
Entièrement Modifiable: Adapté À Vos Besoins Dans Excel Ou Sheets
Conception Professionnelle: Modèles Fiables Et Conformes Aux Normes Du Secteur
Pré-Construits Pour Une Utilisation Rapide Et Efficace
Compatible MAC/PC, entièrement débloqué
Aucune Expertise N'Est Requise; Facile À Suivre
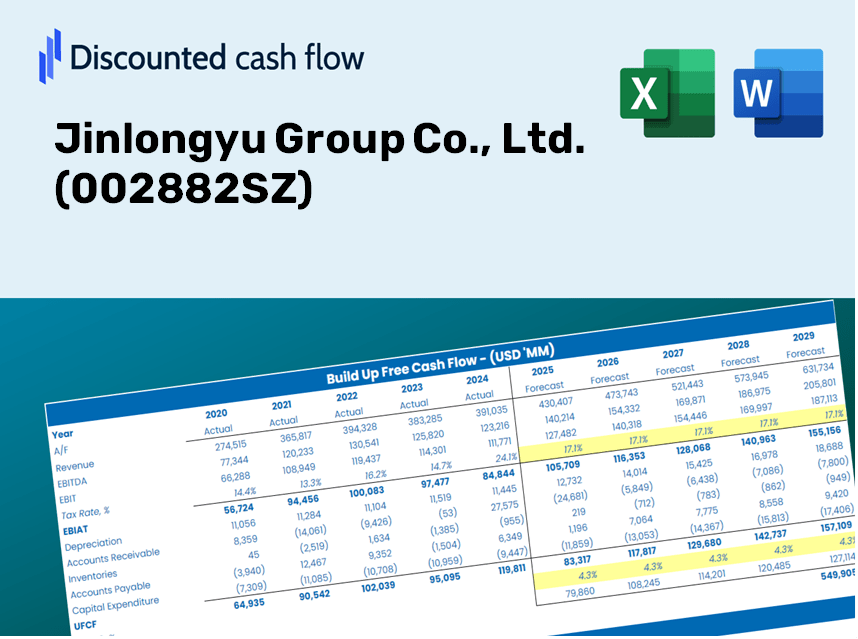
Jinlongyu Group Co., Ltd. (002882.SZ) Bundle
Conçu pour la précision, notre calculatrice DCF (002882SZ) vous permet d'évaluer la valorisation de Jinllongyu Group Co., Ltd. à l'aide de données financières réelles, offrant une flexibilité complète pour modifier tous les paramètres clés pour des projections améliorées.
Discounted Cash Flow (DCF) - (USD MM)
| Year | AY1 2020 |
AY2 2021 |
AY3 2022 |
AY4 2023 |
AY5 2024 |
FY1 2025 |
FY2 2026 |
FY3 2027 |
FY4 2028 |
FY5 2029 |
|---|---|---|---|---|---|---|---|---|---|---|
| Revenue | 3,199.4 | 4,589.6 | 3,973.0 | 3,932.0 | 3,675.2 | 3,881.5 | 4,099.4 | 4,329.5 | 4,572.5 | 4,829.2 |
| Revenue Growth, % | 0 | 43.45 | -13.43 | -1.03 | -6.53 | 5.61 | 5.61 | 5.61 | 5.61 | 5.61 |
| EBITDA | 299.8 | 262.3 | 289.3 | 274.4 | 226.6 | 275.7 | 291.1 | 307.5 | 324.8 | 343.0 |
| EBITDA, % | 9.37 | 5.72 | 7.28 | 6.98 | 6.16 | 7.1 | 7.1 | 7.1 | 7.1 | 7.1 |
| Depreciation | 23.6 | 26.8 | 32.3 | 36.2 | 38.3 | 31.8 | 33.6 | 35.5 | 37.4 | 39.6 |
| Depreciation, % | 0.73623 | 0.58384 | 0.8121 | 0.91985 | 1.04 | 0.81899 | 0.81899 | 0.81899 | 0.81899 | 0.81899 |
| EBIT | 276.2 | 235.5 | 257.0 | 238.2 | 188.2 | 243.9 | 257.6 | 272.0 | 287.3 | 303.4 |
| EBIT, % | 8.63 | 5.13 | 6.47 | 6.06 | 5.12 | 6.28 | 6.28 | 6.28 | 6.28 | 6.28 |
| Total Cash | 536.2 | 300.2 | 415.3 | 667.7 | 917.9 | 587.7 | 620.7 | 655.6 | 692.4 | 731.2 |
| Total Cash, percent | .0 | .0 | .0 | .0 | .0 | .0 | .0 | .0 | .0 | .0 |
| Account Receivables | 1,058.8 | 1,528.7 | 1,224.0 | 1,462.1 | 1,592.3 | 1,379.7 | 1,457.1 | 1,538.9 | 1,625.3 | 1,716.5 |
| Account Receivables, % | 33.09 | 33.31 | 30.81 | 37.19 | 43.33 | 35.54 | 35.54 | 35.54 | 35.54 | 35.54 |
| Inventories | 614.8 | 770.9 | 598.2 | 588.3 | 643.2 | 648.5 | 684.9 | 723.3 | 763.9 | 806.8 |
| Inventories, % | 19.22 | 16.8 | 15.06 | 14.96 | 17.5 | 16.71 | 16.71 | 16.71 | 16.71 | 16.71 |
| Accounts Payable | 59.1 | 71.7 | 56.8 | 62.6 | 902.1 | 240.5 | 254.0 | 268.3 | 283.3 | 299.2 |
| Accounts Payable, % | 1.85 | 1.56 | 1.43 | 1.59 | 24.55 | 6.2 | 6.2 | 6.2 | 6.2 | 6.2 |
| Capital Expenditure | -56.2 | -33.7 | -51.3 | -20.7 | -68.6 | -47.9 | -50.6 | -53.4 | -56.4 | -59.6 |
| Capital Expenditure, % | -1.76 | -0.73334 | -1.29 | -0.52652 | -1.87 | -1.23 | -1.23 | -1.23 | -1.23 | -1.23 |
| Tax Rate, % | 22.21 | 22.21 | 22.21 | 22.21 | 22.21 | 22.21 | 22.21 | 22.21 | 22.21 | 22.21 |
| EBITAT | 200.8 | 173.7 | 194.6 | 183.2 | 146.4 | 183.8 | 194.1 | 205.0 | 216.5 | 228.7 |
| Depreciation | ||||||||||
| Changes in Account Receivables | ||||||||||
| Changes in Inventories | ||||||||||
| Changes in Accounts Payable | ||||||||||
| Capital Expenditure | ||||||||||
| UFCF | -1,446.3 | -446.5 | 638.2 | -23.9 | 770.6 | -286.5 | 76.7 | 81.1 | 85.6 | 90.4 |
| WACC, % | 4.98 | 4.98 | 4.99 | 4.99 | 4.99 | 4.99 | 4.99 | 4.99 | 4.99 | 4.99 |
| PV UFCF | ||||||||||
| SUM PV UFCF | 8.1 | |||||||||
| Long Term Growth Rate, % | 2.00 | |||||||||
| Free cash flow (T + 1) | 92 | |||||||||
| Terminal Value | 3,087 | |||||||||
| Present Terminal Value | 2,420 | |||||||||
| Enterprise Value | 2,428 | |||||||||
| Net Debt | -419 | |||||||||
| Equity Value | 2,847 | |||||||||
| Diluted Shares Outstanding, MM | 433 | |||||||||
| Equity Value Per Share | 6.58 |
Benefits of Choosing Jinlongyu Group Co., Ltd. (002882SZ)
- Editable Forecast Inputs: Effortlessly modify assumptions (growth %, margins, WACC) to explore various scenarios.
- Industry-Specific Data: Pre-populated financial information for Jinlongyu Group to kickstart your analysis.
- Automated DCF Outputs: The template calculates Net Present Value (NPV) and intrinsic value automatically.
- Customizable and Professional: A sophisticated Excel model tailored to meet your valuation requirements.
- Designed for Analysts and Investors: Perfect for testing forecasts, validating strategies, and enhancing efficiency.
Key Features
- Accurate Jinlongyu Financial Data: Pre-loaded with historical financials and future projections for Jinlongyu Group Co., Ltd. (002882SZ).
- Customizable Financial Inputs: Modify revenue growth rates, profit margins, discount rates, tax percentages, and capital investment amounts.
- Interactive Valuation Tool: Automatically updates the Net Present Value (NPV) and intrinsic value based on your specified parameters.
- Scenario Analysis: Generate multiple forecasting scenarios to evaluate various valuation results.
- User-Centric Interface: Intuitive, organized, and suitable for both experts and newcomers.
How It Functions
- 1. Access the Template: Download and open the Excel file featuring Jinlongyu Group Co., Ltd.’s (002882SZ) preloaded data.
- 2. Modify Assumptions: Adjust key variables such as growth rates, WACC, and capital expenditures.
- 3. Observe Results Immediately: The DCF model automatically computes intrinsic value and NPV.
- 4. Evaluate Scenarios: Analyze various forecasts to assess different valuation results.
- 5. Utilize with Confidence: Present expert valuation insights to reinforce your decision-making process.
Why Choose Jinlongyu Group Co., Ltd. (002882SZ)?
- Time Efficiency: Skip the hassle of building a financial model from scratch – our tools are ready for immediate use.
- Enhanced Accuracy: Dependable financial information and formulas help minimize valuation errors.
- Completely Customizable: Adjust the model to align with your specific assumptions and forecasts.
- User-Friendly: Intuitive charts and outputs make analyzing results straightforward.
- Endorsed by Professionals: Crafted for experts who prioritize both accuracy and ease of use.
Who Can Benefit from Jinlongyu Group Co., Ltd. (002882SZ)?
- Investors: Make informed investment choices with our expert valuation tools tailored for precision.
- Financial Analysts: Streamline your workflow with customizable pre-built DCF models designed for efficiency.
- Consultants: Easily modify templates for impactful client presentations or comprehensive reports.
- Finance Enthusiasts: Enhance your grasp of valuation methods through practical, real-world case studies.
- Educators and Students: Utilize this resource as a hands-on learning tool for finance and investment courses.
Contents of the Template
- Operating and Balance Sheet Data: Pre-filled historical data and forecasts for Jinlongyu Group Co., Ltd. (002882SZ), including revenue, EBITDA, EBIT, and capital expenditures.
- WACC Calculation: A dedicated sheet for Weighted Average Cost of Capital (WACC), featuring parameters such as Beta, risk-free rate, and share price.
- DCF Valuation (Unlevered and Levered): Customizable Discounted Cash Flow models illustrating intrinsic value along with detailed calculations.
- Financial Statements: Pre-loaded financial statements (annual and quarterly) to facilitate comprehensive analysis.
- Key Ratios: Includes profitability, leverage, and efficiency ratios specific to Jinlongyu Group Co., Ltd. (002882SZ).
- Dashboard and Charts: Visual representation of valuation outputs and assumptions to simplify analysis of results.
Disclaimer
All information, articles, and product details provided on this website are for general informational and educational purposes only. We do not claim any ownership over, nor do we intend to infringe upon, any trademarks, copyrights, logos, brand names, or other intellectual property mentioned or depicted on this site. Such intellectual property remains the property of its respective owners, and any references here are made solely for identification or informational purposes, without implying any affiliation, endorsement, or partnership.
We make no representations or warranties, express or implied, regarding the accuracy, completeness, or suitability of any content or products presented. Nothing on this website should be construed as legal, tax, investment, financial, medical, or other professional advice. In addition, no part of this site—including articles or product references—constitutes a solicitation, recommendation, endorsement, advertisement, or offer to buy or sell any securities, franchises, or other financial instruments, particularly in jurisdictions where such activity would be unlawful.
All content is of a general nature and may not address the specific circumstances of any individual or entity. It is not a substitute for professional advice or services. Any actions you take based on the information provided here are strictly at your own risk. You accept full responsibility for any decisions or outcomes arising from your use of this website and agree to release us from any liability in connection with your use of, or reliance upon, the content or products found herein.