
|
Yue Yuen Industrial Limited (0551.HK) Valation DCF |
Entièrement Modifiable: Adapté À Vos Besoins Dans Excel Ou Sheets
Conception Professionnelle: Modèles Fiables Et Conformes Aux Normes Du Secteur
Pré-Construits Pour Une Utilisation Rapide Et Efficace
Compatible MAC/PC, entièrement débloqué
Aucune Expertise N'Est Requise; Facile À Suivre
Yue Yuen Industrial (Holdings) Limited (0551.HK) Bundle
Simplifier Yue Yuen Industrial (Holdings) Évaluation limitée avec cette calculatrice DCF personnalisable! Doté de Real Yue Yuen Industrial (Holdings) Limited Financials et des intrants de prévision réglables, vous pouvez tester des scénarios et découvrir Yue Yuen Industrial (Holdings) Limited Fair Value en minutes.
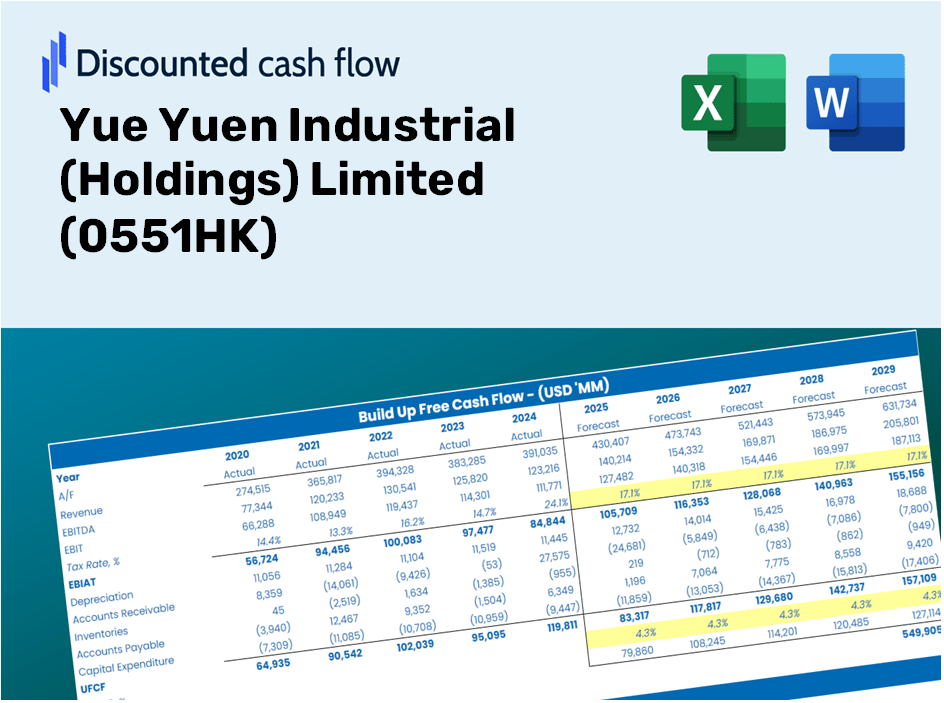
Discounted Cash Flow (DCF) - (USD MM)
| Year | AY1 2020 |
AY2 2021 |
AY3 2022 |
AY4 2023 |
AY5 2024 |
FY1 2025 |
FY2 2026 |
FY3 2027 |
FY4 2028 |
FY5 2029 |
|---|---|---|---|---|---|---|---|---|---|---|
| Revenue | 65,632.5 | 66,319.6 | 69,715.0 | 61,321.0 | 63,590.3 | 63,244.8 | 62,901.2 | 62,559.5 | 62,219.6 | 61,881.5 |
| Revenue Growth, % | 0 | 1.05 | 5.12 | -12.04 | 3.7 | -0.54329 | -0.54329 | -0.54329 | -0.54329 | -0.54329 |
| EBITDA | 4,360.2 | 6,273.9 | 7,570.5 | 6,851.3 | 5,450.4 | 5,907.9 | 5,875.8 | 5,843.9 | 5,812.1 | 5,780.6 |
| EBITDA, % | 6.64 | 9.46 | 10.86 | 11.17 | 8.57 | 9.34 | 9.34 | 9.34 | 9.34 | 9.34 |
| Depreciation | 4,249.6 | 4,530.1 | 3,843.0 | 3,168.4 | 2,127.1 | 3,456.9 | 3,438.2 | 3,419.5 | 3,400.9 | 3,382.4 |
| Depreciation, % | 6.47 | 6.83 | 5.51 | 5.17 | 3.34 | 5.47 | 5.47 | 5.47 | 5.47 | 5.47 |
| EBIT | 110.6 | 1,743.8 | 3,727.5 | 3,683.0 | 3,323.3 | 2,451.0 | 2,437.6 | 2,424.4 | 2,411.2 | 2,398.1 |
| EBIT, % | 0.16846 | 2.63 | 5.35 | 6.01 | 5.23 | 3.88 | 3.88 | 3.88 | 3.88 | 3.88 |
| Total Cash | 7,909.7 | 7,431.3 | 8,357.1 | 8,771.2 | 7,163.5 | 7,692.2 | 7,650.4 | 7,608.9 | 7,567.5 | 7,526.4 |
| Total Cash, percent | .0 | .0 | .0 | .0 | .0 | .0 | .0 | .0 | .0 | .0 |
| Account Receivables | 8,705.5 | 7,439.5 | 7,259.1 | 6,879.2 | 8,195.0 | 7,462.8 | 7,422.3 | 7,382.0 | 7,341.9 | 7,302.0 |
| Account Receivables, % | 13.26 | 11.22 | 10.41 | 11.22 | 12.89 | 11.8 | 11.8 | 11.8 | 11.8 | 11.8 |
| Inventories | 12,317.8 | 15,994.6 | 12,630.1 | 9,691.5 | 10,382.9 | 11,780.5 | 11,716.5 | 11,652.9 | 11,589.6 | 11,526.6 |
| Inventories, % | 18.77 | 24.12 | 18.12 | 15.8 | 16.33 | 18.63 | 18.63 | 18.63 | 18.63 | 18.63 |
| Accounts Payable | 4,646.9 | 5,040.2 | 3,318.0 | 3,695.5 | 3,889.4 | 3,994.9 | 3,973.2 | 3,951.6 | 3,930.1 | 3,908.8 |
| Accounts Payable, % | 7.08 | 7.6 | 4.76 | 6.03 | 6.12 | 6.32 | 6.32 | 6.32 | 6.32 | 6.32 |
| Capital Expenditure | -2,009.3 | -2,252.3 | -1,599.3 | -1,564.1 | -1,576.7 | -1,743.3 | -1,733.8 | -1,724.4 | -1,715.0 | -1,705.7 |
| Capital Expenditure, % | -3.06 | -3.4 | -2.29 | -2.55 | -2.48 | -2.76 | -2.76 | -2.76 | -2.76 | -2.76 |
| Tax Rate, % | 31.41 | 31.41 | 31.41 | 31.41 | 31.41 | 31.41 | 31.41 | 31.41 | 31.41 | 31.41 |
| EBITAT | 195.3 | 1,143.9 | 2,673.0 | 2,592.9 | 2,279.5 | 1,844.6 | 1,834.6 | 1,824.6 | 1,814.7 | 1,804.8 |
| Depreciation | ||||||||||
| Changes in Account Receivables | ||||||||||
| Changes in Inventories | ||||||||||
| Changes in Accounts Payable | ||||||||||
| Capital Expenditure | ||||||||||
| UFCF | -13,940.8 | 1,404.2 | 6,739.4 | 7,893.2 | 1,016.6 | 2,998.2 | 3,621.8 | 3,602.1 | 3,582.5 | 3,563.1 |
| WACC, % | 7.5 | 6.95 | 7.05 | 7.03 | 7 | 7.1 | 7.1 | 7.1 | 7.1 | 7.1 |
| PV UFCF | ||||||||||
| SUM PV UFCF | 14,138.8 | |||||||||
| Long Term Growth Rate, % | 2.00 | |||||||||
| Free cash flow (T + 1) | 3,634 | |||||||||
| Terminal Value | 71,195 | |||||||||
| Present Terminal Value | 50,513 | |||||||||
| Enterprise Value | 64,652 | |||||||||
| Net Debt | 1,658 | |||||||||
| Equity Value | 62,994 | |||||||||
| Diluted Shares Outstanding, MM | 1,612 | |||||||||
| Equity Value Per Share | 39.07 |
What You Will Receive
- Authentic Yue Yuen Data: Preloaded financials – including revenue and EBIT – derived from actual and projected statistics.
- Comprehensive Customization: Modify all critical parameters (yellow cells) such as WACC, growth %, and tax rates.
- Immediate Valuation Adjustments: Automatic recalculations to assess the effects of changes on Yue Yuen's fair value.
- Flexible Excel Template: Designed for quick modifications, scenario analysis, and in-depth forecasts.
- Efficient and Precise: Avoid the hassle of building models from the ground up while ensuring accuracy and adaptability.
Key Features
- Comprehensive YYII Data: Pre-loaded with Yue Yuen Industrial's historical financials and future projections.
- Customizable Inputs: Tailor revenue growth, profit margins, WACC, tax rates, and capital expenditures to suit your analysis.
- Dynamic Valuation Model: Instant updates to Net Present Value (NPV) and intrinsic value based on your custom inputs.
- Scenario Analysis: Generate various forecast scenarios to evaluate different valuation possibilities.
- User-Centric Interface: Streamlined, organized, and crafted for both industry experts and novices.
How It Functions
- Download the Template: Gain immediate access to the Excel-based Yue Yuen Industrial (Holdings) Limited DCF Calculator.
- Enter Your Assumptions: Modify the yellow-highlighted cells for growth rates, WACC, profit margins, and additional variables.
- Instant Calculations: The model will automatically refresh to display Yue Yuen's intrinsic value.
- Explore Scenarios: Test various assumptions to assess potential changes in valuation.
- Evaluate and Decide: Leverage the outcomes to inform your investment or financial strategy.
Why Opt for This Calculator?
- Precision: Utilizes accurate Yue Yuen financials for trustworthy results.
- Versatility: Crafted for users to easily adjust and experiment with inputs.
- Efficiency: Avoid the complexities of building a DCF model from the ground up.
- Expert-Quality: Designed with the expertise and usability expected at the CFO level.
- Intuitive: Simple to navigate, even for those with limited financial modeling skills.
Who Can Benefit from This Product?
- Investors: Accurately assess the fair value of Yue Yuen Industrial (Holdings) Limited (0551HK) before making investment choices.
- CFOs: Utilize a professional-grade DCF model for comprehensive financial reporting and analysis.
- Consultants: Easily customize the template for valuation reports tailored to client needs.
- Entrepreneurs: Acquire valuable insights into financial modeling practices employed by leading industry firms.
- Educators: Implement it as a teaching tool to illustrate various valuation methodologies.
Overview of the Template Components
- Historical Data: Contains Yue Yuen Industrial (Holdings) Limited's past financial performance and foundational forecasts.
- DCF and Levered DCF Models: Comprehensive templates for assessing the intrinsic value of Yue Yuen Industrial (Holdings) Limited.
- WACC Sheet: Pre-configured calculations for the Weighted Average Cost of Capital.
- Editable Inputs: Adjust essential parameters such as growth rates, EBITDA %, and CAPEX projections.
- Quarterly and Annual Statements: A thorough analysis of Yue Yuen Industrial (Holdings) Limited's financials.
- Interactive Dashboard: Dynamically visualize valuation results and future projections.
Disclaimer
All information, articles, and product details provided on this website are for general informational and educational purposes only. We do not claim any ownership over, nor do we intend to infringe upon, any trademarks, copyrights, logos, brand names, or other intellectual property mentioned or depicted on this site. Such intellectual property remains the property of its respective owners, and any references here are made solely for identification or informational purposes, without implying any affiliation, endorsement, or partnership.
We make no representations or warranties, express or implied, regarding the accuracy, completeness, or suitability of any content or products presented. Nothing on this website should be construed as legal, tax, investment, financial, medical, or other professional advice. In addition, no part of this site—including articles or product references—constitutes a solicitation, recommendation, endorsement, advertisement, or offer to buy or sell any securities, franchises, or other financial instruments, particularly in jurisdictions where such activity would be unlawful.
All content is of a general nature and may not address the specific circumstances of any individual or entity. It is not a substitute for professional advice or services. Any actions you take based on the information provided here are strictly at your own risk. You accept full responsibility for any decisions or outcomes arising from your use of this website and agree to release us from any liability in connection with your use of, or reliance upon, the content or products found herein.