
|
EMMI AG (0qm5.l) Évaluation DCF |
Entièrement Modifiable: Adapté À Vos Besoins Dans Excel Ou Sheets
Conception Professionnelle: Modèles Fiables Et Conformes Aux Normes Du Secteur
Pré-Construits Pour Une Utilisation Rapide Et Efficace
Compatible MAC/PC, entièrement débloqué
Aucune Expertise N'Est Requise; Facile À Suivre
Emmi AG (0QM5.L) Bundle
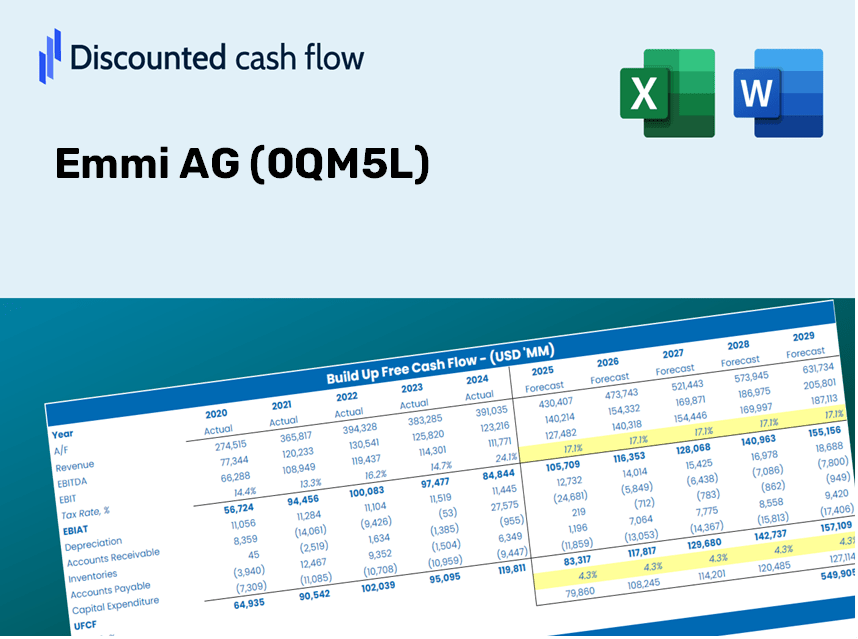
Améliorez vos stratégies d'investissement avec la calculatrice DCF EMMI AG (0QM5L)! Explorez les données financières authentiques des EMMI AG, ajustez les prévisions et les dépenses de croissance et observez instantanément comment les variations affectent la valeur intrinsèque d'Emmi AG.
Your Benefits
- Pre-Configured Financial Model: Emmi AG’s actual data facilitates accurate DCF valuation.
- Comprehensive Forecast Management: Modify revenue growth, profit margins, WACC, and other essential factors.
- Real-Time Calculations: Automatic updates provide immediate feedback as you implement changes.
- Professionally Designed Template: A polished Excel file crafted for high-quality valuation.
- Flexible and Reusable: Adaptable for ongoing use, allowing for thorough forecasting.
Key Features of Emmi AG (0QM5L)
- Accurate Financial Data: Gain access to reliable pre-loaded historical performance and future forecasts.
- Adjustable Forecast Parameters: Modify yellow-highlighted fields such as WACC, growth rates, and profit margins.
- Real-time Calculations: Automatic revisions of DCF, Net Present Value (NPV), and cash flow assessments.
- User-Friendly Dashboard: Clear charts and summaries for an intuitive understanding of your valuation findings.
- Designed for All Skill Levels: A straightforward, user-friendly format tailored for investors, CFOs, and consultants alike.
How It Works
- Step 1: Download the prebuilt Excel template that includes Emmi AG’s (0QM5L) data.
- Step 2: Navigate through the pre-filled sheets to familiarize yourself with the essential metrics.
- Step 3: Modify forecasts and assumptions in the editable yellow cells (WACC, growth, margins).
- Step 4: Instantly view the updated results, including Emmi AG’s (0QM5L) intrinsic value.
- Step 5: Use the outputs to make informed investment decisions or to create reports.
Why Choose the Emmi AG (0QM5L) Calculator?
- Save Time: Get started instantly with a pre-built DCF model instead of building one from the ground up.
- Enhance Accuracy: Dependable financial data and formulas minimize valuation errors.
- Completely Customizable: Adjust the model to mirror your unique assumptions and forecasts.
- User-Friendly: Intuitive charts and outputs simplify result analysis.
- Endorsed by Professionals: Crafted for experts who prioritize precision and ease of use.
Who Can Benefit from This Product?
- Professional Investors: Create comprehensive and trustworthy valuation models for analyzing portfolios involving Emmi AG (0QM5L).
- Corporate Finance Teams: Evaluate valuation scenarios to inform internal strategies at Emmi AG (0QM5L).
- Consultants and Advisors: Equip clients with precise valuation insights related to Emmi AG (0QM5L).
- Students and Educators: Utilize real-world data to learn and teach financial modeling techniques with a focus on Emmi AG (0QM5L).
- Food Industry Enthusiasts: Gain insights into how companies like Emmi AG (0QM5L) are valued within the market.
Contents of the Template
- Preloaded Emmi AG Data: Historical and forecasted financial information, including revenue, EBIT, and capital expenditures.
- DCF and WACC Models: Advanced spreadsheets for calculating intrinsic value and Weighted Average Cost of Capital.
- Editable Inputs: Yellow-highlighted cells for modifying revenue growth, tax rates, and discount rates.
- Financial Statements: Detailed annual and quarterly financial reports for in-depth analysis.
- Key Ratios: Profitability, leverage, and efficiency ratios for performance evaluation.
- Dashboard and Charts: Visual representations of valuation results and underlying assumptions.
Disclaimer
All information, articles, and product details provided on this website are for general informational and educational purposes only. We do not claim any ownership over, nor do we intend to infringe upon, any trademarks, copyrights, logos, brand names, or other intellectual property mentioned or depicted on this site. Such intellectual property remains the property of its respective owners, and any references here are made solely for identification or informational purposes, without implying any affiliation, endorsement, or partnership.
We make no representations or warranties, express or implied, regarding the accuracy, completeness, or suitability of any content or products presented. Nothing on this website should be construed as legal, tax, investment, financial, medical, or other professional advice. In addition, no part of this site—including articles or product references—constitutes a solicitation, recommendation, endorsement, advertisement, or offer to buy or sell any securities, franchises, or other financial instruments, particularly in jurisdictions where such activity would be unlawful.
All content is of a general nature and may not address the specific circumstances of any individual or entity. It is not a substitute for professional advice or services. Any actions you take based on the information provided here are strictly at your own risk. You accept full responsibility for any decisions or outcomes arising from your use of this website and agree to release us from any liability in connection with your use of, or reliance upon, the content or products found herein.