
|
Bell Food Group AG (0RFX.L) DCF Valuation |
Entièrement Modifiable: Adapté À Vos Besoins Dans Excel Ou Sheets
Conception Professionnelle: Modèles Fiables Et Conformes Aux Normes Du Secteur
Pré-Construits Pour Une Utilisation Rapide Et Efficace
Compatible MAC/PC, entièrement débloqué
Aucune Expertise N'Est Requise; Facile À Suivre
Bell Food Group AG (0RFX.L) Bundle
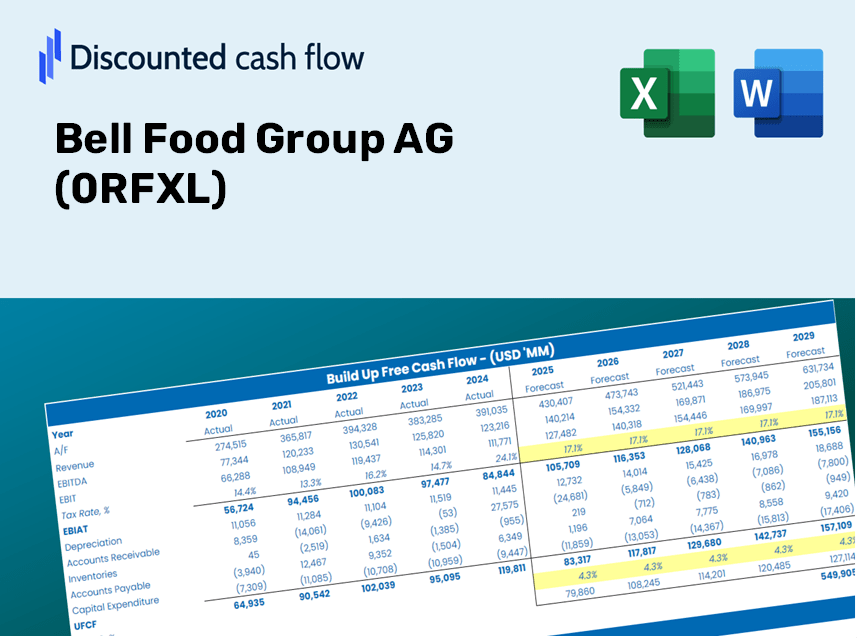
Designed for accuracy, our (0RFXL) DCF Calculator enables you to assess Bell Food Group AG's valuation using real-world financial data, allowing complete flexibility to modify all essential parameters for improved projections.
Discounted Cash Flow (DCF) - (USD MM)
| Year | AY1 2021 |
AY2 2022 |
AY3 2023 |
AY4 2024 |
AY5 2025 |
FY1 2026 |
FY2 2027 |
FY3 2028 |
FY4 2029 |
FY5 2030 |
|---|---|---|---|---|---|---|---|---|---|---|
| Revenue | 4,151.6 | 4,315.0 | 4,514.2 | 4,728.3 | 4,884.8 | 5,038.7 | 5,189.8 | 5,338.0 | 5,483.1 | 5,624.9 |
| Revenue Growth, % | 0 | 3.94 | 4.62 | 4.74 | 3.31 | 3.15 | 3 | 2.86 | 2.72 | 2.59 |
| EBITDA | 324.9 | 320.3 | 335.7 | 351.2 | 367.0 | 379.2 | 390.5 | 401.7 | 412.6 | 423.3 |
| EBITDA, % | 7.83 | 7.42 | 7.44 | 7.43 | 7.51 | 7.53 | 7.53 | 7.53 | 7.53 | 7.53 |
| Depreciation | 163.4 | 162.8 | 173.9 | 183.9 | 253.3 | 274.4 | 296.0 | 318.2 | 341.0 | 364.2 |
| Depreciation, % | 3.94 | 3.77 | 3.85 | 3.89 | 5.19 | 5.44 | 5.7 | 5.96 | 6.22 | 6.48 |
| EBIT | 161.5 | 157.5 | 161.8 | 167.3 | 113.7 | 171.2 | 176.4 | 181.4 | 186.3 | 191.1 |
| EBIT, % | 3.89 | 3.65 | 3.58 | 3.54 | 2.33 | 3.4 | 3.4 | 3.4 | 3.4 | 3.4 |
| Total Cash | 187.2 | 315.7 | 425.7 | 170.8 | 126.1 | 276.6 | 284.9 | 293.1 | 301.0 | 308.8 |
| Total Cash, percent | .0 | .0 | .0 | .0 | .0 | .0 | .0 | .0 | .0 | .0 |
| Account Receivables | 444.9 | 423.7 | 327.1 | 398.7 | 466.4 | 461.2 | 475.0 | 488.6 | 501.8 | 514.8 |
| Account Receivables, % | 10.72 | 9.82 | 7.25 | 8.43 | 9.55 | 9.15 | 9.15 | 9.15 | 9.15 | 9.15 |
| Inventories | 444.2 | 508.6 | 489.9 | 529.1 | 534.3 | 559.0 | 575.7 | 592.2 | 608.3 | 624.0 |
| Inventories, % | 10.7 | 11.79 | 10.85 | 11.19 | 10.94 | 11.09 | 11.09 | 11.09 | 11.09 | 11.09 |
| Accounts Payable | 219.9 | 260.8 | 242.0 | 252.9 | 243.0 | 272.3 | 280.5 | 288.5 | 296.4 | 304.0 |
| Accounts Payable, % | 5.3 | 6.04 | 5.36 | 5.35 | 4.97 | 5.4 | 5.4 | 5.4 | 5.4 | 5.4 |
| Capital Expenditure | -238.9 | -255.2 | -330.1 | -312.8 | -271.5 | -314.0 | -323.4 | -332.6 | -341.6 | -350.5 |
| Capital Expenditure, % | -5.75 | -5.91 | -7.31 | -6.62 | -5.56 | -6.23 | -6.23 | -6.23 | -6.23 | -6.23 |
| Tax Rate, % | 29.12 | 29.12 | 29.12 | 29.12 | 29.12 | 29.12 | 29.12 | 29.12 | 29.12 | 29.12 |
| EBITAT | 133.5 | 131.8 | 138.9 | 135.6 | 80.6 | 138.4 | 142.5 | 146.6 | 150.6 | 154.5 |
| Depreciation | ||||||||||
| Changes in Account Receivables | ||||||||||
| Changes in Inventories | ||||||||||
| Changes in Accounts Payable | ||||||||||
| Capital Expenditure | ||||||||||
| UFCF | -611.2 | 37.1 | 79.2 | -93.2 | -20.4 | 108.7 | 92.7 | 110.2 | 128.4 | 147.2 |
| WACC, % | 4.14 | 4.16 | 4.19 | 4.12 | 3.95 | 4.11 | 4.11 | 4.11 | 4.11 | 4.11 |
| PV UFCF | ||||||||||
| SUM PV UFCF | 517.3 | |||||||||
| Long Term Growth Rate, % | 1.00 | |||||||||
| Free cash flow (T + 1) | 149 | |||||||||
| Terminal Value | 4,774 | |||||||||
| Present Terminal Value | 3,902 | |||||||||
| Enterprise Value | 4,420 | |||||||||
| Net Debt | 866 | |||||||||
| Equity Value | 3,554 | |||||||||
| Diluted Shares Outstanding, MM | 6 | |||||||||
| Equity Value Per Share | 567.12 |
What You Will Receive
- Ready-to-Use Financial Model: Leverage Bell Food Group AG's actual data for accurate DCF valuation.
- Comprehensive Forecast Control: Modify revenue growth, profit margins, WACC, and other essential factors.
- Real-Time Calculations: Automatic updates allow you to view results immediately as adjustments are made.
- Professional-Grade Template: An optimized Excel file crafted for top-tier valuation needs.
- Flexible and Reusable: Designed for adaptability, enabling repeated use for thorough forecasts.
Key Features
- Pre-Loaded Data: Comprehensive historical financial data and forecast models for Bell Food Group AG (0RFXL).
- Fully Adjustable Inputs: Customize parameters such as WACC, tax rates, revenue growth, and EBITDA margins.
- Instant Results: Watch as the intrinsic value of Bell Food Group AG (0RFXL) recalculates instantly.
- Clear Visual Outputs: Intuitive dashboard charts present valuation outcomes and essential metrics.
- Built for Accuracy: A professional-grade tool designed for analysts, investors, and finance professionals.
How It Works
- Step 1: Download the Excel file.
- Step 2: Review Bell Food Group AG's (0RFXL) pre-filled financial data and projections.
- Step 3: Adjust key inputs such as revenue growth, WACC, and tax rates (highlighted cells).
- Step 4: Observe the DCF model update in real-time as you modify your assumptions.
- Step 5: Evaluate the outputs and leverage the results for your investment choices.
Why Opt for This Calculator?
- Precise Information: Authentic Bell Food Group AG financials guarantee trustworthy valuation outcomes.
- Tailorable: Modify essential parameters like growth rates, WACC, and tax rates to align with your forecasts.
- Time-Efficient: Pre-configured calculations save you the effort of starting from scratch.
- Professional-Quality Tool: Crafted for investors, analysts, and consultants.
- User-Friendly: Easy-to-navigate layout and step-by-step guidance make it accessible for all users.
Who Can Benefit from This Product?
- Investors: Accurately assess the fair value of Bell Food Group AG (0RFXL) before making investment choices.
- CFOs: Utilize a professional-grade DCF model for comprehensive financial reporting and analysis.
- Consultants: Effortlessly customize the template for valuation reports tailored to clients.
- Entrepreneurs: Acquire insights into the financial modeling techniques employed by leading companies.
- Educators: Implement it as a teaching resource to illustrate valuation methodologies.
Contents of the Template
- Preloaded Bell Food Group AG Data: Historical and forecasted financial metrics, including revenue, EBIT, and capital expenditures.
- DCF and WACC Models: High-quality spreadsheets designed for calculating intrinsic value and Weighted Average Cost of Capital.
- Customizable Inputs: Cells highlighted in yellow for modifying revenue growth, tax rates, and discount rates.
- Financial Statements: Detailed annual and quarterly financial statements for in-depth analysis.
- Key Ratios: Profitability, leverage, and efficiency ratios to assess overall performance.
- Dashboard and Charts: Visual representations of valuation results and underlying assumptions.
Disclaimer
All information, articles, and product details provided on this website are for general informational and educational purposes only. We do not claim any ownership over, nor do we intend to infringe upon, any trademarks, copyrights, logos, brand names, or other intellectual property mentioned or depicted on this site. Such intellectual property remains the property of its respective owners, and any references here are made solely for identification or informational purposes, without implying any affiliation, endorsement, or partnership.
We make no representations or warranties, express or implied, regarding the accuracy, completeness, or suitability of any content or products presented. Nothing on this website should be construed as legal, tax, investment, financial, medical, or other professional advice. In addition, no part of this site—including articles or product references—constitutes a solicitation, recommendation, endorsement, advertisement, or offer to buy or sell any securities, franchises, or other financial instruments, particularly in jurisdictions where such activity would be unlawful.
All content is of a general nature and may not address the specific circumstances of any individual or entity. It is not a substitute for professional advice or services. Any actions you take based on the information provided here are strictly at your own risk. You accept full responsibility for any decisions or outcomes arising from your use of this website and agree to release us from any liability in connection with your use of, or reliance upon, the content or products found herein.