
|
BEAXT-YUMESHIN GROUP CO. (2154.T) Évaluation DCF |
Entièrement Modifiable: Adapté À Vos Besoins Dans Excel Ou Sheets
Conception Professionnelle: Modèles Fiables Et Conformes Aux Normes Du Secteur
Pré-Construits Pour Une Utilisation Rapide Et Efficace
Compatible MAC/PC, entièrement débloqué
Aucune Expertise N'Est Requise; Facile À Suivre
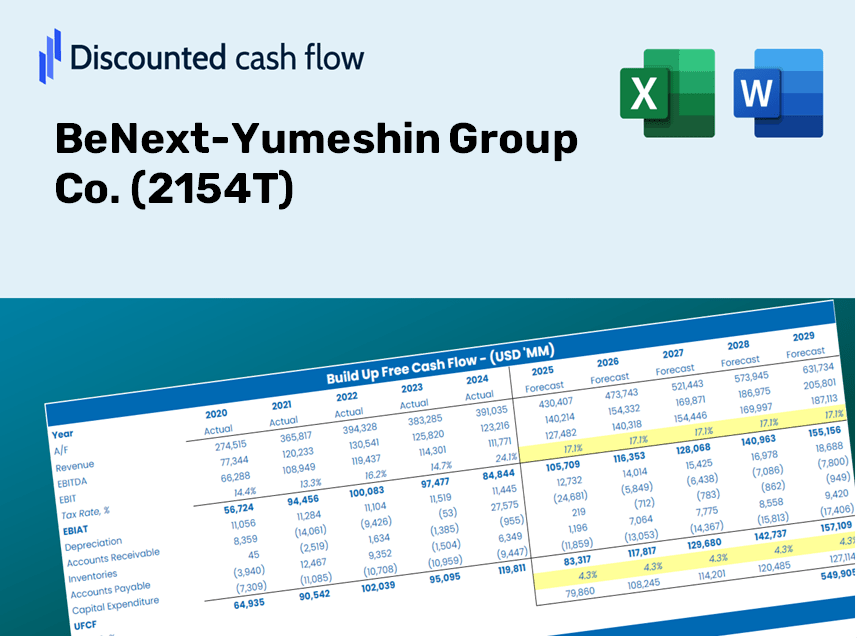
BeNext-Yumeshin Group Co. (2154.T) Bundle
Évaluez les perspectives financières de Benext-Yumeshin Group Co. comme un professionnel! Ce (2154t) Calculator DCF vous fournit des finances pré-remplies et permet une flexibilité totale pour modifier la croissance des revenus, le WACC, les marges et d'autres hypothèses essentielles pour s'aligner sur vos projections.
Discounted Cash Flow (DCF) - (USD MM)
| Year | AY1 2020 |
AY2 2021 |
AY3 2022 |
AY4 2023 |
AY5 2024 |
FY1 2025 |
FY2 2026 |
FY3 2027 |
FY4 2028 |
FY5 2029 |
|---|---|---|---|---|---|---|---|---|---|---|
| Revenue | 98,887.0 | 148,573.0 | 150,697.0 | 173,225.0 | 187,954.0 | 223,255.0 | 265,186.1 | 314,992.6 | 374,153.6 | 444,426.0 |
| Revenue Growth, % | 0 | 50.25 | 1.43 | 14.95 | 8.5 | 18.78 | 18.78 | 18.78 | 18.78 | 18.78 |
| EBITDA | -23,077.0 | 13,429.0 | 14,720.0 | 16,743.0 | 18,721.0 | 6,740.4 | 8,006.4 | 9,510.1 | 11,296.3 | 13,417.9 |
| EBITDA, % | -23.34 | 9.04 | 9.77 | 9.67 | 9.96 | 3.02 | 3.02 | 3.02 | 3.02 | 3.02 |
| Depreciation | 1,883.0 | 3,008.0 | 2,242.0 | 2,150.0 | 2,405.0 | 3,544.1 | 4,209.7 | 5,000.4 | 5,939.5 | 7,055.1 |
| Depreciation, % | 1.9 | 2.02 | 1.49 | 1.24 | 1.28 | 1.59 | 1.59 | 1.59 | 1.59 | 1.59 |
| EBIT | -24,960.0 | 10,421.0 | 12,478.0 | 14,593.0 | 16,316.0 | 3,196.3 | 3,796.7 | 4,509.7 | 5,356.7 | 6,362.8 |
| EBIT, % | -25.24 | 7.01 | 8.28 | 8.42 | 8.68 | 1.43 | 1.43 | 1.43 | 1.43 | 1.43 |
| Total Cash | 21,095.0 | 12,404.0 | 16,077.0 | 21,506.0 | 20,353.0 | 28,395.1 | 33,728.2 | 40,062.9 | 47,587.4 | 56,525.1 |
| Total Cash, percent | .0 | .0 | .0 | .0 | .0 | .0 | .0 | .0 | .0 | .0 |
| Account Receivables | 19,913.0 | 20,108.0 | 22,354.0 | 24,705.0 | 20,515.0 | 32,899.6 | 39,078.7 | 46,418.3 | 55,136.5 | 65,492.1 |
| Account Receivables, % | 20.14 | 13.53 | 14.83 | 14.26 | 10.91 | 14.74 | 14.74 | 14.74 | 14.74 | 14.74 |
| Inventories | 215.0 | .0 | .0 | .0 | .0 | 97.1 | 115.3 | 137.0 | 162.7 | 193.3 |
| Inventories, % | 0.21742 | 0 | 0 | 0 | 0 | 0.04348398 | 0.04348398 | 0.04348398 | 0.04348398 | 0.04348398 |
| Accounts Payable | 457.0 | 2,617.0 | 2,448.0 | 2,786.0 | 2,511.0 | 3,032.8 | 3,602.4 | 4,279.0 | 5,082.7 | 6,037.3 |
| Accounts Payable, % | 0.46214 | 1.76 | 1.62 | 1.61 | 1.34 | 1.36 | 1.36 | 1.36 | 1.36 | 1.36 |
| Capital Expenditure | -307.0 | -565.0 | -727.0 | -730.0 | -769.0 | -894.7 | -1,062.7 | -1,262.3 | -1,499.4 | -1,781.0 |
| Capital Expenditure, % | -0.31046 | -0.38028 | -0.48242 | -0.42142 | -0.40914 | -0.40074 | -0.40074 | -0.40074 | -0.40074 | -0.40074 |
| Tax Rate, % | 22.34 | 22.34 | 22.34 | 22.34 | 22.34 | 22.34 | 22.34 | 22.34 | 22.34 | 22.34 |
| EBITAT | -27,010.5 | 7,099.7 | 9,510.1 | 11,799.5 | 12,670.8 | 2,575.3 | 3,059.0 | 3,633.6 | 4,316.0 | 5,126.7 |
| Depreciation | ||||||||||
| Changes in Account Receivables | ||||||||||
| Changes in Inventories | ||||||||||
| Changes in Accounts Payable | ||||||||||
| Capital Expenditure | ||||||||||
| UFCF | -45,105.5 | 11,722.7 | 8,610.1 | 11,206.5 | 18,221.8 | -6,735.1 | 578.3 | 686.9 | 815.9 | 969.2 |
| WACC, % | 7.39 | 7.32 | 7.34 | 7.35 | 7.34 | 7.35 | 7.35 | 7.35 | 7.35 | 7.35 |
| PV UFCF | ||||||||||
| SUM PV UFCF | -3,922.6 | |||||||||
| Long Term Growth Rate, % | 3.00 | |||||||||
| Free cash flow (T + 1) | 998 | |||||||||
| Terminal Value | 22,957 | |||||||||
| Present Terminal Value | 16,104 | |||||||||
| Enterprise Value | 12,181 | |||||||||
| Net Debt | -15,323 | |||||||||
| Equity Value | 27,504 | |||||||||
| Diluted Shares Outstanding, MM | 87 | |||||||||
| Equity Value Per Share | 316.12 |
Benefits You Will Receive
- Comprehensive (2154T) Financial Data: Access to both historical and projected figures for precise valuation.
- Customizable Parameters: Adjust metrics such as WACC, tax rates, revenue growth, and capital expenditures.
- Real-Time Calculations: Intrinsic value and NPV calculations update automatically.
- Scenario Exploration: Analyze various scenarios to assess the future outlook of BeNext-Yumeshin Group.
- User-Friendly Interface: Designed for professionals while remaining easy to navigate for newcomers.
Key Features
- Customizable Forecast Variables: Adjust essential inputs such as revenue growth, EBITDA margin, and capital investments.
- Instant DCF Valuation: Quickly computes intrinsic value, NPV, and additional metrics.
- High-Precision Accuracy: Leverages real financial data from BeNext-Yumeshin Group Co. (2154T) for credible valuation results.
- Simplified Scenario Analysis: Effortlessly explore various assumptions and assess their impacts.
- Efficiency Boost: Avoid the complexities of constructing detailed valuation models from the ground up.
How It Works
- 1. Access the Template: Download and open the Excel file containing BeNext-Yumeshin Group Co.’s (2154T) preloaded data.
- 2. Adjust Key Assumptions: Modify important inputs like growth rates, WACC, and capital expenditures.
- 3. Instant Results: The DCF model automatically calculates the intrinsic value and NPV.
- 4. Explore Scenarios: Evaluate various forecasts to examine different valuation results.
- 5. Present with Assurance: Share expert valuation insights to strengthen your decision-making process.
Why Opt for BeNext-Yumeshin Group Co. (2154T) Calculator?
- User-Friendly Interface: Perfect for both novices and seasoned professionals.
- Customizable Inputs: Easily adjust variables to suit your specific analysis.
- Real-Time Updates: Watch instant changes in BeNext-Yumeshin’s valuation as you modify inputs.
- Preloaded Financial Data: Comes equipped with BeNext-Yumeshin's actual financial figures for immediate analysis.
- Relied Upon by Experts: Trusted by investors and financial analysts for informed decision-making.
Who Can Benefit from BeNext-Yumeshin Group Co. (2154T)?
- Investors: Evaluate BeNext-Yumeshin's valuation to make informed stock trading decisions.
- CFOs and Financial Analysts: Optimize valuation workflows and assess financial forecasts.
- Startup Founders: Discover the valuation strategies of established companies like BeNext-Yumeshin.
- Consultants: Create comprehensive valuation reports to support your clients' needs.
- Students and Educators: Utilize current data to learn and teach effective valuation methodologies.
Contents of the Template
- Operating and Balance Sheet Data: Pre-filled historical data and forecasts for BeNext-Yumeshin Group Co. (2154T), including revenue, EBITDA, EBIT, and capital expenditures.
- WACC Calculation: A dedicated sheet for calculating the Weighted Average Cost of Capital (WACC), featuring parameters such as Beta, risk-free rate, and share price.
- DCF Valuation (Unlevered and Levered): Customizable Discounted Cash Flow models that provide intrinsic value with comprehensive calculations.
- Financial Statements: Pre-loaded annual and quarterly financial statements to facilitate thorough analysis.
- Key Ratios: Includes key profitability, leverage, and efficiency ratios for BeNext-Yumeshin Group Co. (2154T).
- Dashboard and Charts: A visual summary of valuation outputs and assumptions for easy analysis of results.
Disclaimer
All information, articles, and product details provided on this website are for general informational and educational purposes only. We do not claim any ownership over, nor do we intend to infringe upon, any trademarks, copyrights, logos, brand names, or other intellectual property mentioned or depicted on this site. Such intellectual property remains the property of its respective owners, and any references here are made solely for identification or informational purposes, without implying any affiliation, endorsement, or partnership.
We make no representations or warranties, express or implied, regarding the accuracy, completeness, or suitability of any content or products presented. Nothing on this website should be construed as legal, tax, investment, financial, medical, or other professional advice. In addition, no part of this site—including articles or product references—constitutes a solicitation, recommendation, endorsement, advertisement, or offer to buy or sell any securities, franchises, or other financial instruments, particularly in jurisdictions where such activity would be unlawful.
All content is of a general nature and may not address the specific circumstances of any individual or entity. It is not a substitute for professional advice or services. Any actions you take based on the information provided here are strictly at your own risk. You accept full responsibility for any decisions or outcomes arising from your use of this website and agree to release us from any liability in connection with your use of, or reliance upon, the content or products found herein.