
|
Sapporo Holdings Limited (2501.T) Évaluation DCF |
Entièrement Modifiable: Adapté À Vos Besoins Dans Excel Ou Sheets
Conception Professionnelle: Modèles Fiables Et Conformes Aux Normes Du Secteur
Pré-Construits Pour Une Utilisation Rapide Et Efficace
Compatible MAC/PC, entièrement débloqué
Aucune Expertise N'Est Requise; Facile À Suivre
Sapporo Holdings Limited (2501.T) Bundle
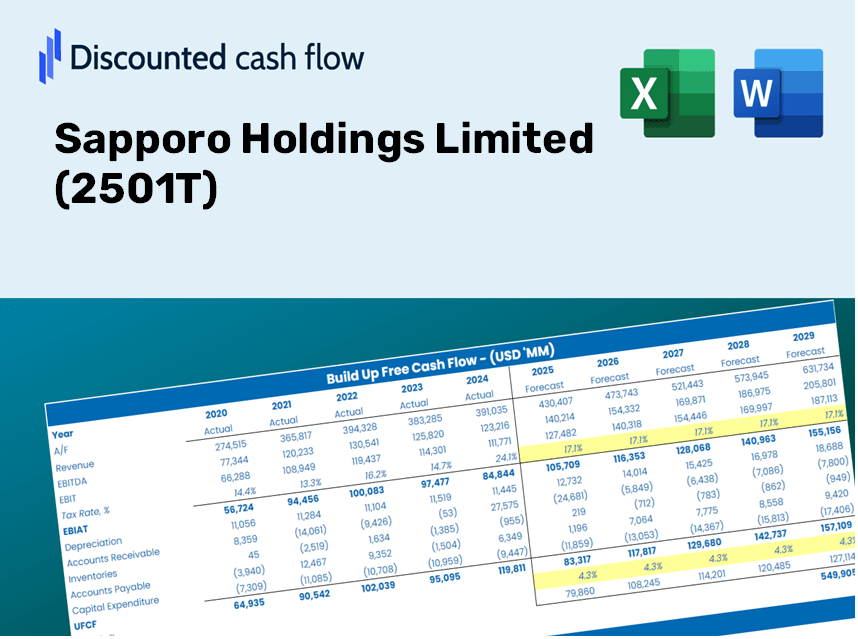
Améliorez vos choix d'investissement avec la calculatrice DCF de Sapporo Holdings Limited (2501T)! Plongez dans des données financières authentiques, ajustez les prédictions et les dépenses de croissance et observez instantanément comment ces modifications affectent la valeur intrinsèque de Sapporo Holdings Limited (2501T).
What You Will Receive
- Adjustable Forecast Inputs: Easily modify assumptions (growth %, margins, WACC) to develop various scenarios.
- Real-World Data: Sapporo Holdings Limited’s financial information pre-filled to accelerate your analysis.
- Automated DCF Outputs: The template computes Net Present Value (NPV) and intrinsic value for you.
- Customizable and Professional: A refined Excel model that tailors to your valuation requirements.
- Designed for Analysts and Investors: Perfect for assessing projections, validating strategies, and enhancing efficiency.
Key Features
- Accurate Financial Data for Sapporo Holdings: Access reliable historical financial information and future projections tailored for Sapporo Holdings Limited (2501T).
- Customizable Forecast Inputs: Modify yellow-highlighted fields such as WACC, growth rates, and profit margins to suit your analysis.
- Real-Time Calculations: Instant updates for DCF, Net Present Value (NPV), and cash flow assessments.
- Interactive Dashboard: User-friendly charts and summaries to effectively present your valuation findings.
- Designed for All Skill Levels: An intuitive layout ideal for investors, CFOs, and consultants, whether you are experienced or just starting.
How It Functions
- Download: Obtain the pre-prepared Excel file containing Sapporo Holdings Limited’s (2501T) financial data.
- Customize: Tailor your forecasts, including revenue growth, EBITDA %, and WACC metrics.
- Real-Time Updates: Intrinsic value and NPV calculations refresh automatically as you make changes.
- Scenario Testing: Generate multiple projections and instantly assess their outcomes.
- Informed Decisions: Leverage the valuation results to steer your investment strategy effectively.
Why Opt for This Calculator?
- User-Friendly Interface: Perfectly crafted for both novices and seasoned users.
- Customizable Inputs: Adjust parameters seamlessly for tailored analysis.
- Real-Time Insights: Observe immediate shifts in Sapporo Holdings Limited's valuation as you modify inputs.
- Pre-Loaded Data: Comes equipped with Sapporo's actual financial information for rapid assessment.
- Preferred by Experts: Widely utilized by investors and analysts for informed decision-making.
Who Should Consider This Product?
- Investors: Evaluate the valuation of Sapporo Holdings Limited (2501T) before making stock transactions.
- CFOs and Financial Analysts: Optimize valuation procedures and assess financial projections.
- Startup Founders: Understand the valuation strategies of prominent public companies like Sapporo Holdings Limited (2501T).
- Consultants: Provide detailed valuation reports to your clients based on Sapporo Holdings Limited (2501T).
- Students and Educators: Utilize real-time data from Sapporo Holdings Limited (2501T) to learn and teach valuation methodologies.
Contents of the Template
- Pre-Filled Data: Contains Sapporo Holdings Limited's historical financials and projections.
- Discounted Cash Flow Model: Editable DCF valuation model with automatic computation features.
- Weighted Average Cost of Capital (WACC): A separate sheet for calculating WACC using customized inputs.
- Key Financial Ratios: Evaluate Sapporo's profitability, efficiency, and capital structure.
- Customizable Inputs: Easily modify revenue growth, profit margins, and tax rates.
- Clear Dashboard: Visual charts and tables summarizing essential valuation outcomes.
Disclaimer
All information, articles, and product details provided on this website are for general informational and educational purposes only. We do not claim any ownership over, nor do we intend to infringe upon, any trademarks, copyrights, logos, brand names, or other intellectual property mentioned or depicted on this site. Such intellectual property remains the property of its respective owners, and any references here are made solely for identification or informational purposes, without implying any affiliation, endorsement, or partnership.
We make no representations or warranties, express or implied, regarding the accuracy, completeness, or suitability of any content or products presented. Nothing on this website should be construed as legal, tax, investment, financial, medical, or other professional advice. In addition, no part of this site—including articles or product references—constitutes a solicitation, recommendation, endorsement, advertisement, or offer to buy or sell any securities, franchises, or other financial instruments, particularly in jurisdictions where such activity would be unlawful.
All content is of a general nature and may not address the specific circumstances of any individual or entity. It is not a substitute for professional advice or services. Any actions you take based on the information provided here are strictly at your own risk. You accept full responsibility for any decisions or outcomes arising from your use of this website and agree to release us from any liability in connection with your use of, or reliance upon, the content or products found herein.