
|
Vats Liquor Chain Store Management Joint Stock Co., Ltd. (300755.SZ) Évaluation DCF |
Entièrement Modifiable: Adapté À Vos Besoins Dans Excel Ou Sheets
Conception Professionnelle: Modèles Fiables Et Conformes Aux Normes Du Secteur
Pré-Construits Pour Une Utilisation Rapide Et Efficace
Compatible MAC/PC, entièrement débloqué
Aucune Expertise N'Est Requise; Facile À Suivre
VATS Liquor Chain Store Management Joint Stock Co., Ltd. (300755.SZ) Bundle
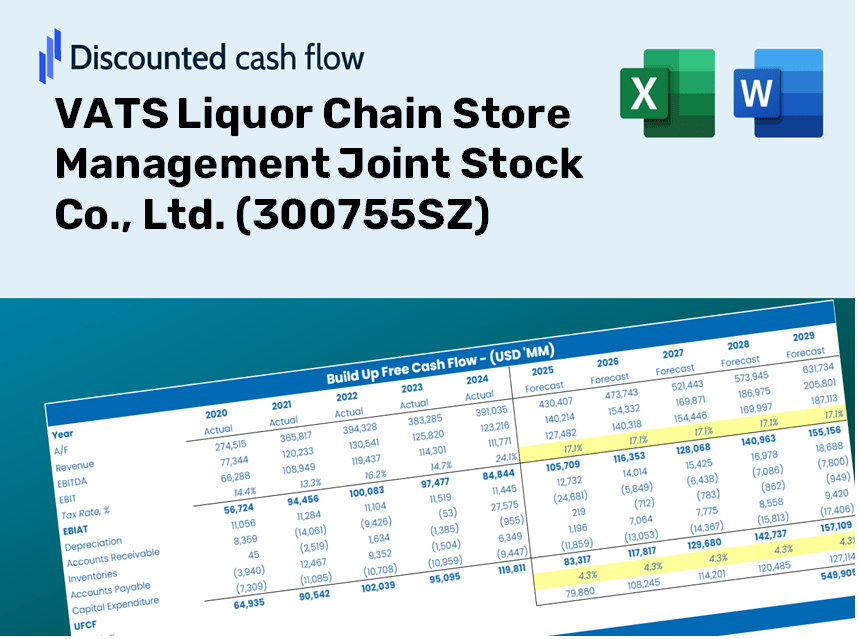
Explorez les perspectives financières de la gestion de la chaîne d'alcools Vats Management Joint Stock Co., Ltd. (300755SZ) avec notre calculatrice DCF facile à utiliser! Entrez vos hypothèses sur la croissance, les marges et les coûts pour déterminer la valeur intrinsèque de Vats Liquor Store Management Joint Stock Co., Ltd. (300755SZ) et façonnez votre approche d'investissement.
Benefits You Will Receive
- Comprehensive VATS Financial Data: Access historical and forecasted information for precise valuation.
- Customizable Parameters: Adjust factors such as WACC, tax rates, revenue growth, and capital investments.
- Real-Time Calculations: Intrinsic value and NPV are automatically updated.
- Scenario Simulation: Explore various scenarios to analyze VATS's future performance.
- User-Friendly Interface: Designed for professionals but easy for newcomers to navigate.
Key Features
- 🔍 Real-Life VATS Financials: Pre-filled historical and projected data for VATS Liquor Chain Store Management Joint Stock Co., Ltd. (300755SZ).
- ✏️ Fully Customizable Inputs: Modify all essential parameters (yellow cells) such as WACC, growth %, and tax rates.
- 📊 Professional DCF Valuation: Built-in formulas compute VATS's intrinsic value using the Discounted Cash Flow approach.
- ⚡ Instant Results: Visualize VATS's valuation immediately after making adjustments.
- Scenario Analysis: Evaluate and compare outcomes for different financial assumptions side-by-side.
How It Works
- Step 1: Download the prebuilt Excel template featuring data for VATS Liquor Chain Store Management Joint Stock Co., Ltd. (300755SZ).
- Step 2: Review the pre-filled sheets to familiarize yourself with the essential metrics.
- Step 3: Modify forecasts and assumptions in the editable yellow cells (WACC, growth, margins).
- Step 4: Instantly see recalculated results, including the intrinsic value of VATS (300755SZ).
- Step 5: Use the generated outputs to make well-informed investment decisions or create detailed reports.
Why Opt for Our Solution?
- Designed for Industry Experts: A sophisticated tool utilized by store managers, financial analysts, and logistics consultants.
- Up-to-Date Market Data: Comprehensive historical and forecasted financials for VATS Liquor Chain Store Management (300755SZ) included for precise analysis.
- Flexible Scenario Analysis: Effortlessly test various market scenarios and business assumptions.
- Insightful Outputs: Automatically computes key performance indicators, ROI, and other essential metrics.
- User-Friendly Interface: Intuitive step-by-step guidance makes navigation simple.
Who Can Benefit from Our Services?
- Retail Managers: Enhance your store’s efficiency with our advanced management tools.
- Industry Researchers: Integrate our data into your studies and analysis of the liquor market.
- Investors: Evaluate your investment strategies and assess potential outcomes for VATS Liquor Chain Store Management (300755SZ).
- Business Analysts: Improve your reporting and forecasting with our customizable analytics platform.
- Entrepreneurs: Learn from the operational strategies of large-scale liquor retailers to inform your business decisions.
What the Template Includes for VATS Liquor Chain Store Management Joint Stock Co., Ltd. (300755SZ)
- Preloaded VATS Data: Historical and projected financial metrics, such as revenue, EBIT, and capital expenditures.
- DCF and WACC Models: Advanced spreadsheets for calculating intrinsic value and Weighted Average Cost of Capital.
- Editable Inputs: Cells highlighted in yellow for modifying revenue growth, tax rates, and discount rates.
- Financial Statements: Detailed annual and quarterly financial reports for in-depth analysis.
- Key Ratios: Metrics for profitability, leverage, and efficiency to assess performance.
- Dashboard and Charts: Visual representations of valuation outcomes and underlying assumptions.
Disclaimer
All information, articles, and product details provided on this website are for general informational and educational purposes only. We do not claim any ownership over, nor do we intend to infringe upon, any trademarks, copyrights, logos, brand names, or other intellectual property mentioned or depicted on this site. Such intellectual property remains the property of its respective owners, and any references here are made solely for identification or informational purposes, without implying any affiliation, endorsement, or partnership.
We make no representations or warranties, express or implied, regarding the accuracy, completeness, or suitability of any content or products presented. Nothing on this website should be construed as legal, tax, investment, financial, medical, or other professional advice. In addition, no part of this site—including articles or product references—constitutes a solicitation, recommendation, endorsement, advertisement, or offer to buy or sell any securities, franchises, or other financial instruments, particularly in jurisdictions where such activity would be unlawful.
All content is of a general nature and may not address the specific circumstances of any individual or entity. It is not a substitute for professional advice or services. Any actions you take based on the information provided here are strictly at your own risk. You accept full responsibility for any decisions or outcomes arising from your use of this website and agree to release us from any liability in connection with your use of, or reliance upon, the content or products found herein.