
|
Toei Animation Co., Ltd. (4816.t) Évaluation DCF |
Entièrement Modifiable: Adapté À Vos Besoins Dans Excel Ou Sheets
Conception Professionnelle: Modèles Fiables Et Conformes Aux Normes Du Secteur
Pré-Construits Pour Une Utilisation Rapide Et Efficace
Compatible MAC/PC, entièrement débloqué
Aucune Expertise N'Est Requise; Facile À Suivre
Toei Animation Co.,Ltd. (4816.T) Bundle
Élevez votre stratégie d'investissement avec la calculatrice DCF d'animation TOEI! Explorez les finances authentiques de TOEI, ajustez les projections et dépenses de croissance et observez instantanément comment ces modifications affectent la valeur intrinsèque de l'animation TOEI.
What You Will Receive
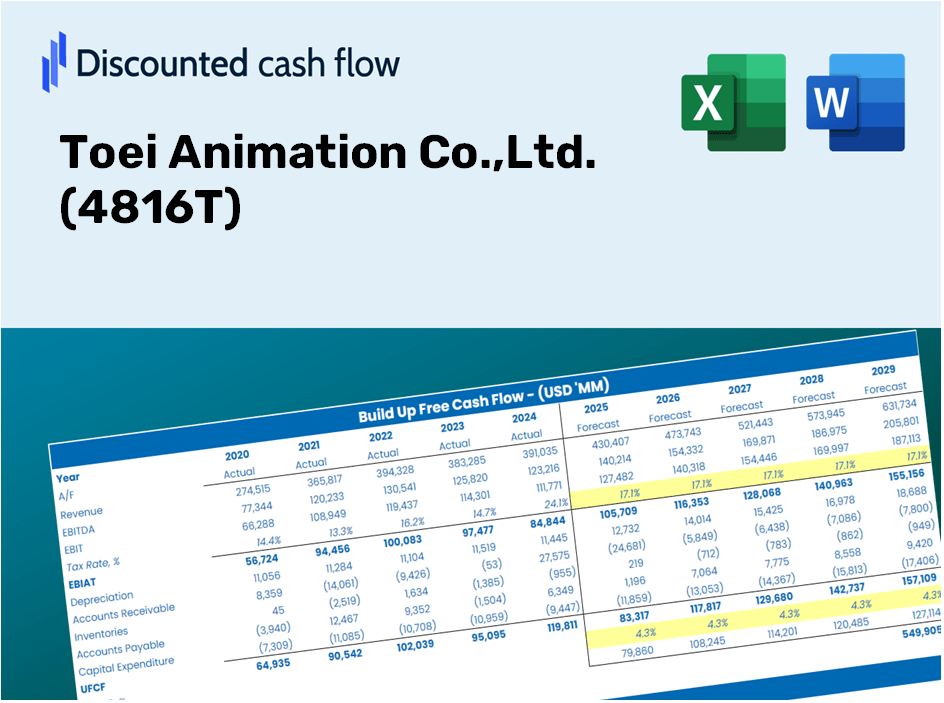
- Customizable Excel Template: A fully adaptable Excel-based DCF Calculator featuring pre-filled financial data for Toei Animation Co., Ltd. (4816T).
- Real-Time Data: Historical figures and future projections (highlighted in the yellow cells).
- Adjustable Forecasts: Modify key assumptions such as revenue growth, EBITDA percentage, and WACC.
- Instant Calculations: Quickly observe how your inputs affect Toei Animation’s valuation.
- Professional Resource: Designed for investors, CFOs, consultants, and financial analysts.
- Intuitive Interface: Organized for ease of navigation, complete with step-by-step guidance.
Key Features
- Comprehensive DCF Calculator: Offers detailed unlevered and levered DCF valuation models tailored for Toei Animation Co., Ltd. (4816T).
- WACC Calculator: Features a pre-constructed Weighted Average Cost of Capital sheet with adjustable inputs.
- Customizable Forecast Assumptions: Easily adjust growth rates, capital expenditures, and discount rates as needed.
- Integrated Financial Ratios: Evaluate profitability, leverage, and efficiency ratios specific to Toei Animation Co., Ltd. (4816T).
- Interactive Dashboard and Charts: Visual representations highlight crucial valuation metrics for simplified analysis.
How It Functions
- Step 1: Download the Excel spreadsheet.
- Step 2: Examine the pre-filled Toei Animation data (historical and projected).
- Step 3: Modify key assumptions (highlighted in yellow) according to your analysis.
- Step 4: Observe automatic updates for Toei Animation’s intrinsic value.
- Step 5: Utilize the results for investment decisions or reporting purposes.
Why Choose This Calculator for Toei Animation Co., Ltd. (4816T)?
- Designed for Industry Experts: A specialized tool favored by analysts, CFOs, and industry consultants.
- Accurate Financials: Toei Animation’s historical and projected financial data preloaded for reliability.
- Flexible Scenario Analysis: Effortlessly test various forecasts and assumptions.
- Comprehensive Outputs: Instantly computes intrinsic value, NPV, and vital metrics.
- User-Friendly Interface: Step-by-step guidance makes navigation simple and intuitive.
Who Should Use This Product?
- Investors: Accurately assess Toei Animation's fair value before making investment choices.
- CFOs: Utilize a professional-grade DCF model for financial reporting and strategic analysis.
- Consultants: Adapt the template swiftly for valuation reports tailored to clients.
- Entrepreneurs: Discover insights into financial modeling practices employed by leading animation studios.
- Educators: Implement it as a teaching resource to illustrate valuation techniques.
Contents of the Template
- Preloaded Toei Animation Data: Historical and forecasted financial metrics, including revenue, EBIT, and capital expenditures.
- DCF and WACC Models: Advanced worksheets for determining intrinsic value and Weighted Average Cost of Capital.
- Editable Inputs: Yellow-highlighted fields for modifying revenue growth rates, tax percentages, and discount rates.
- Financial Statements: Detailed annual and quarterly financial reports for comprehensive analysis.
- Key Ratios: Metrics for profitability, leverage, and efficiency to assess performance.
- Dashboard and Charts: Visual representations of valuation results and underlying assumptions.
Disclaimer
All information, articles, and product details provided on this website are for general informational and educational purposes only. We do not claim any ownership over, nor do we intend to infringe upon, any trademarks, copyrights, logos, brand names, or other intellectual property mentioned or depicted on this site. Such intellectual property remains the property of its respective owners, and any references here are made solely for identification or informational purposes, without implying any affiliation, endorsement, or partnership.
We make no representations or warranties, express or implied, regarding the accuracy, completeness, or suitability of any content or products presented. Nothing on this website should be construed as legal, tax, investment, financial, medical, or other professional advice. In addition, no part of this site—including articles or product references—constitutes a solicitation, recommendation, endorsement, advertisement, or offer to buy or sell any securities, franchises, or other financial instruments, particularly in jurisdictions where such activity would be unlawful.
All content is of a general nature and may not address the specific circumstances of any individual or entity. It is not a substitute for professional advice or services. Any actions you take based on the information provided here are strictly at your own risk. You accept full responsibility for any decisions or outcomes arising from your use of this website and agree to release us from any liability in connection with your use of, or reliance upon, the content or products found herein.