
|
Jiangsu Kanion Pharmaceutical Co., Ltd. (600557.SS) Évaluation DCF |
Entièrement Modifiable: Adapté À Vos Besoins Dans Excel Ou Sheets
Conception Professionnelle: Modèles Fiables Et Conformes Aux Normes Du Secteur
Pré-Construits Pour Une Utilisation Rapide Et Efficace
Compatible MAC/PC, entièrement débloqué
Aucune Expertise N'Est Requise; Facile À Suivre
Jiangsu Kanion Pharmaceutical Co.,Ltd. (600557.SS) Bundle
Découvrez la vraie valeur de Jiangsu Kanion Pharmaceutical Co., Ltd. (600557SS) avec notre calculatrice avancée DCF! Ajustez les hypothèses cruciales, explorez divers scénarios et évaluez comment les différents changements affectent Jiangsu Kanion Pharmaceutical Co., Ltd. (600557SS) Évaluation - Tout dans un modèle d'excel complet.
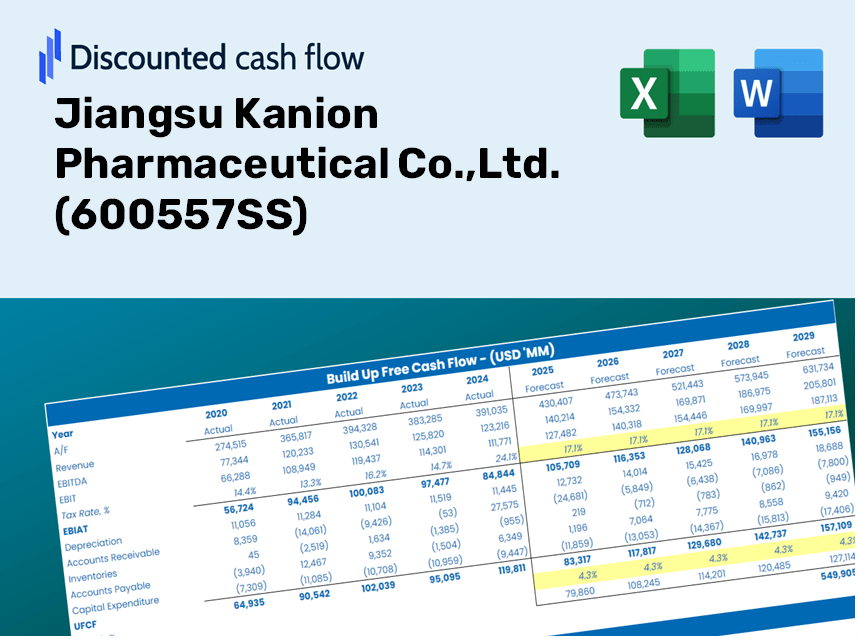
Discounted Cash Flow (DCF) - (USD MM)
| Year | AY1 2020 |
AY2 2021 |
AY3 2022 |
AY4 2023 |
AY5 2024 |
FY1 2025 |
FY2 2026 |
FY3 2027 |
FY4 2028 |
FY5 2029 |
|---|---|---|---|---|---|---|---|---|---|---|
| Revenue | 3,031.9 | 3,648.6 | 4,350.9 | 4,863.8 | 3,897.7 | 4,204.7 | 4,536.0 | 4,893.3 | 5,278.8 | 5,694.7 |
| Revenue Growth, % | 0 | 20.34 | 19.25 | 11.79 | -19.86 | 7.88 | 7.88 | 7.88 | 7.88 | 7.88 |
| EBITDA | 530.9 | 507.1 | 588.8 | 604.5 | 486.4 | 587.4 | 633.7 | 683.6 | 737.5 | 795.6 |
| EBITDA, % | 17.51 | 13.9 | 13.53 | 12.43 | 12.48 | 13.97 | 13.97 | 13.97 | 13.97 | 13.97 |
| Depreciation | 159.6 | 187.0 | 189.8 | 194.9 | 196.4 | 200.1 | 215.9 | 232.9 | 251.2 | 271.0 |
| Depreciation, % | 5.26 | 5.13 | 4.36 | 4.01 | 5.04 | 4.76 | 4.76 | 4.76 | 4.76 | 4.76 |
| EBIT | 371.3 | 320.1 | 399.0 | 409.6 | 290.0 | 387.3 | 417.8 | 450.7 | 486.2 | 524.5 |
| EBIT, % | 12.25 | 8.77 | 9.17 | 8.42 | 7.44 | 9.21 | 9.21 | 9.21 | 9.21 | 9.21 |
| Total Cash | 773.3 | 1,113.4 | 1,771.3 | 2,429.3 | 2,235.1 | 1,715.7 | 1,850.9 | 1,996.7 | 2,154.0 | 2,323.7 |
| Total Cash, percent | .0 | .0 | .0 | .0 | .0 | .0 | .0 | .0 | .0 | .0 |
| Account Receivables | 1,630.5 | 1,361.8 | 1,480.4 | 1,096.0 | 706.9 | 1,394.3 | 1,504.1 | 1,622.6 | 1,750.4 | 1,888.3 |
| Account Receivables, % | 53.78 | 37.32 | 34.03 | 22.53 | 18.14 | 33.16 | 33.16 | 33.16 | 33.16 | 33.16 |
| Inventories | 376.5 | 338.1 | 342.8 | 350.1 | 540.3 | 425.7 | 459.3 | 495.4 | 534.5 | 576.6 |
| Inventories, % | 12.42 | 9.27 | 7.88 | 7.2 | 13.86 | 10.12 | 10.12 | 10.12 | 10.12 | 10.12 |
| Accounts Payable | 281.0 | 359.7 | 373.4 | 228.4 | 226.9 | 321.5 | 346.8 | 374.1 | 403.6 | 435.4 |
| Accounts Payable, % | 9.27 | 9.86 | 8.58 | 4.7 | 5.82 | 7.65 | 7.65 | 7.65 | 7.65 | 7.65 |
| Capital Expenditure | -190.3 | -171.5 | -211.1 | -297.5 | -476.7 | -287.4 | -310.0 | -334.5 | -360.8 | -389.2 |
| Capital Expenditure, % | -6.28 | -4.7 | -4.85 | -6.12 | -12.23 | -6.84 | -6.84 | -6.84 | -6.84 | -6.84 |
| Tax Rate, % | -1.84 | -1.84 | -1.84 | -1.84 | -1.84 | -1.84 | -1.84 | -1.84 | -1.84 | -1.84 |
| EBITAT | 331.6 | 312.6 | 388.9 | 424.4 | 295.3 | 375.2 | 404.8 | 436.7 | 471.1 | 508.2 |
| Depreciation | ||||||||||
| Changes in Account Receivables | ||||||||||
| Changes in Inventories | ||||||||||
| Changes in Accounts Payable | ||||||||||
| Capital Expenditure | ||||||||||
| UFCF | -1,425.1 | 713.9 | 257.9 | 554.0 | 212.4 | -190.3 | 192.6 | 207.7 | 224.1 | 241.8 |
| WACC, % | 8.19 | 8.21 | 8.21 | 8.22 | 8.22 | 8.21 | 8.21 | 8.21 | 8.21 | 8.21 |
| PV UFCF | ||||||||||
| SUM PV UFCF | 479.0 | |||||||||
| Long Term Growth Rate, % | 3.50 | |||||||||
| Free cash flow (T + 1) | 250 | |||||||||
| Terminal Value | 5,313 | |||||||||
| Present Terminal Value | 3,581 | |||||||||
| Enterprise Value | 4,060 | |||||||||
| Net Debt | -2,195 | |||||||||
| Equity Value | 6,255 | |||||||||
| Diluted Shares Outstanding, MM | 576 | |||||||||
| Equity Value Per Share | 10.85 |
What You Will Receive
- Genuine 600557SS Financial Data: Access to both historical and projected figures for precise valuation.
- Customizable Parameters: Adjust WACC, tax rates, revenue growth, and capital investments as needed.
- Automated Calculations: Dynamic computation of intrinsic value and NPV.
- Scenario Analysis: Explore various scenarios to assess Jiangsu Kanion Pharmaceutical Co., Ltd.'s future outlook.
- User-Friendly Interface: Designed for industry experts while remaining accessible to newcomers.
Key Features
- Comprehensive 600557SS Data: Pre-loaded with Jiangsu Kanion Pharmaceutical’s historical financial performance and future financial forecasts.
- Fully Customizable Parameters: Tailor revenue growth, profit margins, WACC, tax rates, and capital investment as needed.
- Dynamic Valuation Framework: Automatic recalculations of Net Present Value (NPV) and intrinsic value based on your customized inputs.
- Scenario Analysis: Develop various projection scenarios to evaluate different potential valuation results.
- Intuitive User Interface: A streamlined, organized design suitable for both seasoned professionals and newcomers.
How It Works
- Step 1: Download the Excel file.
- Step 2: Review Jiangsu Kanion Pharmaceutical Co., Ltd.’s pre-filled financial data and projections.
- Step 3: Adjust key inputs such as revenue growth, WACC, and tax rates (highlighted cells).
- Step 4: Observe the DCF model update in real time as you modify your assumptions.
- Step 5: Evaluate the results and utilize the insights for investment strategies.
Why Opt for This Calculator?
- Precision: Utilizes authentic Jiangsu Kanion Pharmaceutical financials for reliable data.
- Versatility: Crafted to empower users to explore and adjust inputs effortlessly.
- Efficiency: Avoid the complexities of constructing a financial model from the ground up.
- Expert-Grade: Built with the expertise and functionality expected at the CFO level.
- Intuitive: Designed for ease of use, making it accessible for individuals with minimal financial modeling expertise.
Who Can Benefit from This Product?
- Pharmacy Students: Master pharmaceutical valuation methods while working with actual data.
- Researchers: Utilize advanced models in your academic projects or studies.
- Investors: Validate your investment strategies by analyzing the valuation of Jiangsu Kanion Pharmaceutical Co.,Ltd. (600557SS).
- Market Analysts: Enhance your efficiency with a ready-to-use, customizable DCF model specific to the pharmaceutical sector.
- Entrepreneurs: Discover insights into how major pharmaceutical companies like Jiangsu Kanion are evaluated.
What the Template Includes
- Pre-Filled Data: Contains Jiangsu Kanion Pharmaceutical's historical financials and forecasts.
- Discounted Cash Flow Model: An editable DCF valuation model with automatic calculations.
- Weighted Average Cost of Capital (WACC): A specific sheet for calculating WACC based on custom inputs.
- Key Financial Ratios: Evaluate Jiangsu Kanion Pharmaceutical's profitability, efficiency, and leverage.
- Customizable Inputs: Easily adjust revenue growth, margins, and tax rates.
- Concise Dashboard: Visualizations and tables summarizing important valuation outcomes.
Disclaimer
All information, articles, and product details provided on this website are for general informational and educational purposes only. We do not claim any ownership over, nor do we intend to infringe upon, any trademarks, copyrights, logos, brand names, or other intellectual property mentioned or depicted on this site. Such intellectual property remains the property of its respective owners, and any references here are made solely for identification or informational purposes, without implying any affiliation, endorsement, or partnership.
We make no representations or warranties, express or implied, regarding the accuracy, completeness, or suitability of any content or products presented. Nothing on this website should be construed as legal, tax, investment, financial, medical, or other professional advice. In addition, no part of this site—including articles or product references—constitutes a solicitation, recommendation, endorsement, advertisement, or offer to buy or sell any securities, franchises, or other financial instruments, particularly in jurisdictions where such activity would be unlawful.
All content is of a general nature and may not address the specific circumstances of any individual or entity. It is not a substitute for professional advice or services. Any actions you take based on the information provided here are strictly at your own risk. You accept full responsibility for any decisions or outcomes arising from your use of this website and agree to release us from any liability in connection with your use of, or reliance upon, the content or products found herein.