
|
Foshan Haitian Arlading and Food Company Ltd. (603288.SS) Évaluation DCF |
Entièrement Modifiable: Adapté À Vos Besoins Dans Excel Ou Sheets
Conception Professionnelle: Modèles Fiables Et Conformes Aux Normes Du Secteur
Pré-Construits Pour Une Utilisation Rapide Et Efficace
Compatible MAC/PC, entièrement débloqué
Aucune Expertise N'Est Requise; Facile À Suivre
Foshan Haitian Flavouring and Food Company Ltd. (603288.SS) Bundle
Optimisez votre temps et améliorez la précision avec notre calculatrice DCF (603288SS)! Avec des données réelles de Foshan Haitian Arlading and Food Company Ltd. et des hypothèses personnalisables, cet outil vous permet de prévoir, analyser et valoriser (603288SS) comme un investisseur chevronné.
What You Will Get
- Authentic Foshan Data: Comprehensive financials – covering everything from revenue to EBIT – based on real and projected figures.
- Complete Customization: Modify all essential parameters (yellow cells) including WACC, growth %, and tax rates.
- Instant Valuation Adjustments: Automatic recalculations to evaluate the effects of changes on Foshan Haitian’s fair value.
- Flexible Excel Template: Designed for easy edits, scenario analysis, and thorough forecasting.
- Efficient and Precise: Eliminate the need to build models from the ground up while ensuring accuracy and adaptability.
Key Features
- Comprehensive 603288SS Data: Includes historical financials and forward-looking projections specific to Foshan Haitian Flavouring and Food Company Ltd.
- Fully Customizable Inputs: Modify revenue growth rates, profit margins, WACC, tax rates, and capital expenditures.
- Dynamic Valuation Model: Automatically updates Net Present Value (NPV) and intrinsic value based on your customized inputs.
- Scenario Testing: Develop multiple forecasting scenarios to assess various valuation outcomes.
- User-Friendly Interface: Intuitive design that accommodates both professionals and novices.
How It Works
- Step 1: Download the Excel file.
- Step 2: Review pre-entered data for Foshan Haitian Flavouring and Food Company Ltd. (603288SS) including historical and projected figures.
- Step 3: Modify key assumptions (highlighted in yellow) according to your insights.
- Step 4: Observe automatic recalculations for the intrinsic value of Foshan Haitian Flavouring and Food Company Ltd. (603288SS).
- Step 5: Utilize the outputs for making informed investment decisions or for reporting purposes.
Why Choose This Calculator for Foshan Haitian Flavouring and Food Company Ltd. (603288SS)?
- Reliable Data: Actual financial information from Foshan Haitian ensures trustworthy valuation outcomes.
- Flexible Options: Tailor essential variables such as growth rates, WACC, and tax rates to align with your forecasts.
- Efficient: Built-in calculations save you the time of starting from the ground up.
- Professional-Quality Tool: Crafted for investors, analysts, and consultants in the food industry.
- User-Friendly Interface: An intuitive design and clear instructions allow users of all levels to navigate effortlessly.
Who Can Benefit from Foshan Haitian Flavouring and Food Company Ltd. (603288SS)?
- Investors: Gain a competitive edge with an advanced valuation tool tailored for informed investment choices.
- Financial Analysts: Enhance efficiency by utilizing a customizable DCF model designed for quick implementation.
- Consultants: Effortlessly modify the template for engaging client presentations or comprehensive reports.
- Food Industry Enthusiasts: Expand your knowledge of valuation methods through practical, real-world scenarios.
- Educators and Students: Employ it as a valuable resource for hands-on learning in finance and food industry courses.
Contents of the Template
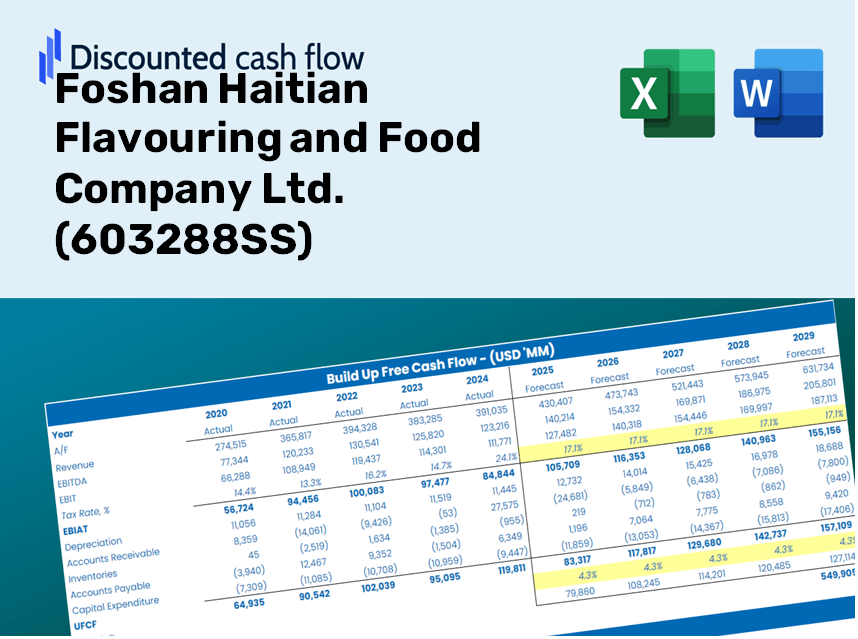
- Operating and Balance Sheet Data: Pre-filled historical data and forecasts for Foshan Haitian Flavouring and Food Company Ltd. (603288SS), including revenue, EBITDA, EBIT, and capital expenditures.
- WACC Calculation: A dedicated sheet for the Weighted Average Cost of Capital (WACC), featuring parameters such as Beta, risk-free rate, and share price.
- DCF Valuation (Unlevered and Levered): Customizable Discounted Cash Flow models displaying intrinsic value with comprehensive calculations.
- Financial Statements: Pre-loaded financial statements (annual and quarterly) to facilitate thorough analysis.
- Key Ratios: Includes profitability, leverage, and efficiency ratios for Foshan Haitian Flavouring and Food Company Ltd. (603288SS).
- Dashboard and Charts: Visual representation of valuation outputs and assumptions to easily evaluate results.
Disclaimer
All information, articles, and product details provided on this website are for general informational and educational purposes only. We do not claim any ownership over, nor do we intend to infringe upon, any trademarks, copyrights, logos, brand names, or other intellectual property mentioned or depicted on this site. Such intellectual property remains the property of its respective owners, and any references here are made solely for identification or informational purposes, without implying any affiliation, endorsement, or partnership.
We make no representations or warranties, express or implied, regarding the accuracy, completeness, or suitability of any content or products presented. Nothing on this website should be construed as legal, tax, investment, financial, medical, or other professional advice. In addition, no part of this site—including articles or product references—constitutes a solicitation, recommendation, endorsement, advertisement, or offer to buy or sell any securities, franchises, or other financial instruments, particularly in jurisdictions where such activity would be unlawful.
All content is of a general nature and may not address the specific circumstances of any individual or entity. It is not a substitute for professional advice or services. Any actions you take based on the information provided here are strictly at your own risk. You accept full responsibility for any decisions or outcomes arising from your use of this website and agree to release us from any liability in connection with your use of, or reliance upon, the content or products found herein.