
|
Mitsubishi Shokuhin Co., Ltd. (7451.T) Évaluation DCF |
Entièrement Modifiable: Adapté À Vos Besoins Dans Excel Ou Sheets
Conception Professionnelle: Modèles Fiables Et Conformes Aux Normes Du Secteur
Pré-Construits Pour Une Utilisation Rapide Et Efficace
Compatible MAC/PC, entièrement débloqué
Aucune Expertise N'Est Requise; Facile À Suivre
Mitsubishi Shokuhin Co., Ltd. (7451.T) Bundle
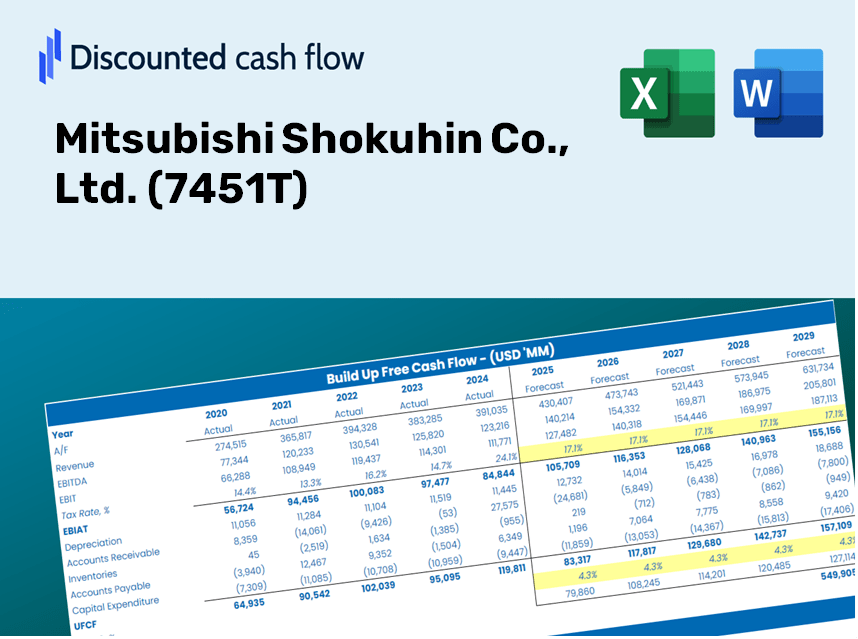
Découvrez le véritable potentiel de Mitsubishi Shokuhin Co., Ltd. (7451T) avec notre calculatrice avancée DCF! Ajustez les hypothèses clés, explorez divers scénarios et évaluez comment les changements affectent la valorisation de Mitsubishi Shokuhin Co., Ltd. (7451T) - le tout dans un seul modèle Excel.
What You Will Receive
- Pre-Filled Financial Model: Utilize Mitsubishi Shokuhin Co., Ltd.'s ([7451T]) actual data for accurate DCF valuation.
- Comprehensive Forecast Control: Modify revenue growth, margins, WACC, and other essential metrics.
- Real-Time Calculations: Automatic updates provide immediate results as you make adjustments.
- Investor-Ready Template: A polished Excel file crafted for high-quality valuation purposes.
- Flexible and Reusable: Designed for adaptability, making it suitable for ongoing detailed forecasts.
Key Features
- Customizable Forecast Inputs: Adjust essential factors such as revenue projections, EBITDA margins, and capital investment plans.
- Instant DCF Valuation: Automatically computes intrinsic value, NPV, and other critical metrics.
- High-Precision Accuracy: Leverages Mitsubishi Shokuhin's real financial data for dependable valuation results.
- Effortless Scenario Analysis: Easily experiment with various assumptions and evaluate different outcomes.
- Efficiency Booster: Streamline your process by bypassing the need for intricate valuation models from the ground up.
How It Functions
- Step 1: Download the pre-configured Excel template featuring Mitsubishi Shokuhin Co., Ltd.'s data.
- Step 2: Review the pre-filled sheets to familiarize yourself with the essential metrics.
- Step 3: Modify forecasts and assumptions in the editable yellow cells (WACC, growth, margins).
- Step 4: Instantly observe recalculated outcomes, including Mitsubishi Shokuhin Co., Ltd.'s intrinsic value.
- Step 5: Make well-informed investment choices or create reports based on the generated outputs.
Why Opt for This Calculator?
- User-Friendly: Crafted for both novices and seasoned professionals.
- Customizable Inputs: Easily adjust parameters to suit your analysis.
- Real-Time Updates: Observe immediate shifts in Mitsubishi Shokuhin’s valuation as you modify inputs.
- Pre-Configured: Comes with Mitsubishi Shokuhin's actual financial data for swift evaluations.
- Relied Upon by Experts: Utilized by investors and analysts for making well-informed decisions.
Who Can Benefit from This Product?
- Professional Investors: Develop comprehensive and reliable valuation models for portfolio assessments related to Mitsubishi Shokuhin Co., Ltd. (7451T).
- Corporate Finance Teams: Evaluate valuation scenarios to inform internal strategies for Mitsubishi Shokuhin Co., Ltd. (7451T).
- Consultants and Advisors: Deliver precise valuation insights to clients considering investments in Mitsubishi Shokuhin Co., Ltd. (7451T).
- Students and Educators: Utilize real-world data for financial modeling exercises and teaching purposes centered around Mitsubishi Shokuhin Co., Ltd. (7451T).
- Industry Enthusiasts: Gain insights into the valuation principles of companies like Mitsubishi Shokuhin Co., Ltd. (7451T) within the marketplace.
Contents of the Template
- Pre-Filled Data: Contains Mitsubishi Shokuhin Co., Ltd.'s historical financial performance and projections.
- Discounted Cash Flow Model: An editable DCF valuation model with automatic calculations included.
- Weighted Average Cost of Capital (WACC): A specific sheet for calculating WACC with user-defined inputs.
- Key Financial Ratios: Evaluate Mitsubishi Shokuhin Co., Ltd.'s profitability, operational efficiency, and financial leverage.
- Customizable Inputs: Easily modify projections for revenue growth, profit margins, and tax rates.
- Clear Dashboard: Visual representations and summaries of essential valuation outcomes.
Disclaimer
All information, articles, and product details provided on this website are for general informational and educational purposes only. We do not claim any ownership over, nor do we intend to infringe upon, any trademarks, copyrights, logos, brand names, or other intellectual property mentioned or depicted on this site. Such intellectual property remains the property of its respective owners, and any references here are made solely for identification or informational purposes, without implying any affiliation, endorsement, or partnership.
We make no representations or warranties, express or implied, regarding the accuracy, completeness, or suitability of any content or products presented. Nothing on this website should be construed as legal, tax, investment, financial, medical, or other professional advice. In addition, no part of this site—including articles or product references—constitutes a solicitation, recommendation, endorsement, advertisement, or offer to buy or sell any securities, franchises, or other financial instruments, particularly in jurisdictions where such activity would be unlawful.
All content is of a general nature and may not address the specific circumstances of any individual or entity. It is not a substitute for professional advice or services. Any actions you take based on the information provided here are strictly at your own risk. You accept full responsibility for any decisions or outcomes arising from your use of this website and agree to release us from any liability in connection with your use of, or reliance upon, the content or products found herein.