
|
Toyota Tsusho Corporation (8015.T) Évaluation DCF |
Entièrement Modifiable: Adapté À Vos Besoins Dans Excel Ou Sheets
Conception Professionnelle: Modèles Fiables Et Conformes Aux Normes Du Secteur
Pré-Construits Pour Une Utilisation Rapide Et Efficace
Compatible MAC/PC, entièrement débloqué
Aucune Expertise N'Est Requise; Facile À Suivre
Toyota Tsusho Corporation (8015.T) Bundle
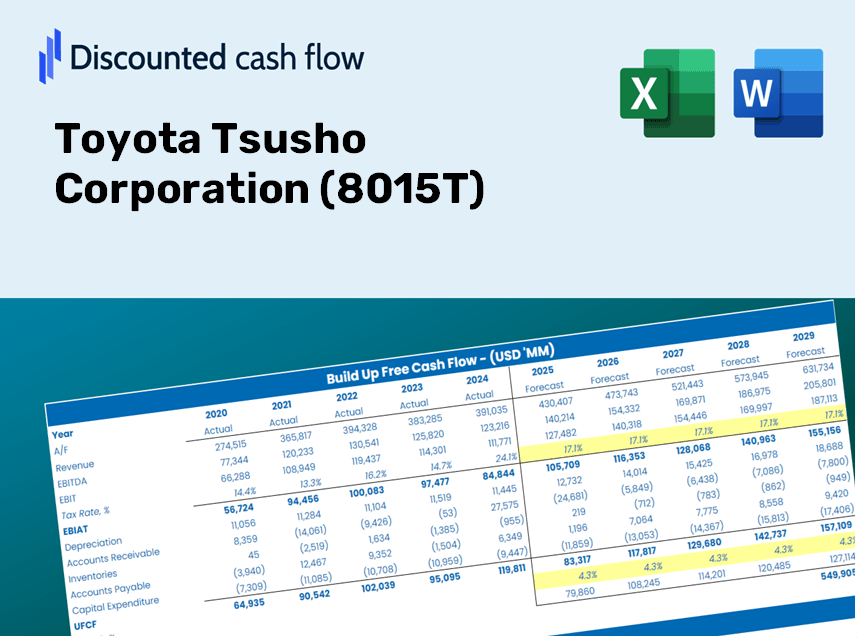
Explorez les perspectives financières de Toyota Tsusho Corporation (8015T) avec notre calculatrice DCF conviviale! Entrez vos hypothèses concernant la croissance, les marges et les dépenses pour calculer la valeur intrinsèque de Toyota Tsusho Corporation (8015T) et améliorer votre approche d'investissement.
Discounted Cash Flow (DCF) - (USD MM)
| Year | AY1 2021 |
AY2 2022 |
AY3 2023 |
AY4 2024 |
AY5 2025 |
FY1 2026 |
FY2 2027 |
FY3 2028 |
FY4 2029 |
FY5 2030 |
|---|---|---|---|---|---|---|---|---|---|---|
| Revenue | 6,694,071.0 | 6,309,303.0 | 8,028,000.0 | 9,848,560.0 | 10,188,980.0 | 11,402,155.4 | 12,759,780.4 | 14,279,054.3 | 15,979,224.2 | 17,881,829.0 |
| Revenue Growth, % | 0 | -5.75 | 27.24 | 22.68 | 3.46 | 11.91 | 11.91 | 11.91 | 11.91 | 11.91 |
| EBITDA | 364,800.0 | 346,431.0 | 449,740.0 | 572,137.0 | 652,276.0 | 655,707.5 | 733,780.9 | 821,150.3 | 918,922.5 | 1,028,336.2 |
| EBITDA, % | 5.45 | 5.49 | 5.6 | 5.81 | 6.4 | 5.75 | 5.75 | 5.75 | 5.75 | 5.75 |
| Depreciation | 103,558.0 | 104,349.0 | 110,885.0 | 128,984.0 | 140,172.0 | 165,730.9 | 185,464.1 | 207,546.8 | 232,258.8 | 259,913.3 |
| Depreciation, % | 1.55 | 1.65 | 1.38 | 1.31 | 1.38 | 1.45 | 1.45 | 1.45 | 1.45 | 1.45 |
| EBIT | 261,242.0 | 242,082.0 | 338,855.0 | 443,153.0 | 512,104.0 | 489,976.6 | 548,316.8 | 613,603.5 | 686,663.6 | 768,422.9 |
| EBIT, % | 3.9 | 3.84 | 4.22 | 4.5 | 5.03 | 4.3 | 4.3 | 4.3 | 4.3 | 4.3 |
| Total Cash | 496,372.0 | 677,478.0 | 653,013.0 | 771,613.0 | 878,705.0 | 974,790.9 | 1,090,856.8 | 1,220,742.3 | 1,366,092.9 | 1,528,750.0 |
| Total Cash, percent | .0 | .0 | .0 | .0 | .0 | .0 | .0 | .0 | .0 | .0 |
| Account Receivables | 1,252,145.0 | 1,404,988.0 | 1,797,084.0 | 1,730,426.0 | 1,797,818.0 | 2,247,913.8 | 2,515,567.1 | 2,815,089.1 | 3,150,274.5 | 3,525,369.5 |
| Account Receivables, % | 18.71 | 22.27 | 22.39 | 17.57 | 17.64 | 19.71 | 19.71 | 19.71 | 19.71 | 19.71 |
| Inventories | 783,606.0 | 840,709.0 | 1,161,022.0 | 1,227,393.0 | 1,203,659.0 | 1,454,209.1 | 1,627,358.0 | 1,821,123.3 | 2,037,959.7 | 2,280,614.3 |
| Inventories, % | 11.71 | 13.32 | 14.46 | 12.46 | 11.81 | 12.75 | 12.75 | 12.75 | 12.75 | 12.75 |
| Accounts Payable | 1,117,407.0 | 1,292,348.0 | 1,677,590.0 | 1,611,030.0 | 1,612,609.0 | 2,058,259.1 | 2,303,330.6 | 2,577,582.2 | 2,884,488.2 | 3,227,936.8 |
| Accounts Payable, % | 16.69 | 20.48 | 20.9 | 16.36 | 15.83 | 18.05 | 18.05 | 18.05 | 18.05 | 18.05 |
| Capital Expenditure | -103,808.0 | -124,327.0 | -135,769.0 | -160,980.0 | -175,031.0 | -195,316.0 | -218,571.8 | -244,596.6 | -273,720.1 | -306,311.2 |
| Capital Expenditure, % | -1.55 | -1.97 | -1.69 | -1.63 | -1.72 | -1.71 | -1.71 | -1.71 | -1.71 | -1.71 |
| Tax Rate, % | 29.43 | 29.43 | 29.43 | 29.43 | 29.43 | 29.43 | 29.43 | 29.43 | 29.43 | 29.43 |
| EBITAT | 157,525.4 | 147,160.3 | 228,108.1 | 294,818.4 | 361,413.3 | 318,981.7 | 356,962.0 | 399,464.5 | 447,027.7 | 500,254.2 |
| Depreciation | ||||||||||
| Changes in Account Receivables | ||||||||||
| Changes in Inventories | ||||||||||
| Changes in Accounts Payable | ||||||||||
| Capital Expenditure | ||||||||||
| UFCF | -761,068.6 | 92,177.3 | -123,942.9 | 196,549.4 | 284,475.3 | 34,400.6 | 128,123.6 | 143,379.0 | 160,450.7 | 179,555.2 |
| WACC, % | 5.82 | 5.83 | 5.9 | 5.89 | 5.94 | 5.88 | 5.88 | 5.88 | 5.88 | 5.88 |
| PV UFCF | ||||||||||
| SUM PV UFCF | 530,212.3 | |||||||||
| Long Term Growth Rate, % | 1.00 | |||||||||
| Free cash flow (T + 1) | 181,351 | |||||||||
| Terminal Value | 3,717,764 | |||||||||
| Present Terminal Value | 2,794,179 | |||||||||
| Enterprise Value | 3,324,391 | |||||||||
| Net Debt | 1,252,511 | |||||||||
| Equity Value | 2,071,880 | |||||||||
| Diluted Shares Outstanding, MM | 1,056 | |||||||||
| Equity Value Per Share | 1,962.65 |
What You Will Receive
- Editable Forecast Parameters: Modify key assumptions (growth %, margins, WACC) to explore various scenarios.
- Real-World Financial Data: Toyota Tsusho Corporation’s financial information pre-loaded to facilitate your analysis.
- Automatic DCF Calculations: The template computes Net Present Value (NPV) and intrinsic value automatically for you.
- Customizable and Professional Design: A sleek Excel model tailored to meet your valuation requirements.
- Designed for Analysts and Investors: Perfect for testing forecasts, validating strategies, and enhancing efficiency.
Key Features
- 🔍 Real-Life 8015T Financials: Easily accessible historical and projected data for Toyota Tsusho Corporation.
- ✏️ Fully Customizable Inputs: Modify all essential parameters (yellow cells) such as WACC, growth %, and tax rates.
- 📊 Professional DCF Valuation: Integrated formulas determine Toyota Tsusho's intrinsic value using the Discounted Cash Flow method.
- ⚡ Instant Results: View Toyota Tsusho's valuation immediately after adjustments.
- Scenario Analysis: Evaluate and compare results for different financial assumptions side-by-side.
How It Operates
- Download the Template: Gain immediate access to the Excel-based Toyota Tsusho Corporation (8015T) DCF Calculator.
- Input Your Assumptions: Modify the yellow-highlighted cells for growth projections, WACC, profit margins, and additional factors.
- Instant Calculations: The model dynamically updates the intrinsic value of Toyota Tsusho Corporation (8015T).
- Test Scenarios: Experiment with various assumptions to assess potential changes in valuation.
- Analyze and Decide: Leverage the results to inform your investment strategies or financial assessments.
Why Opt for This Calculator?
- Time-Efficient: Skip the hassle of building a DCF model from the ground up – it's already set up for you.
- Enhanced Precision: Dependable financial data and established formulas minimize valuation errors.
- Completely Customizable: Adjust the model to align with your unique assumptions and forecasts.
- User-Friendly: Intuitive charts and outputs simplify the analysis of results.
- Endorsed by Professionals: Crafted for experts who prioritize accuracy and ease of use.
Who Can Benefit from This Product?
- Investors: Assess Toyota Tsusho Corporation’s (8015T) valuation before making stock trades.
- CFOs and Financial Analysts: Enhance valuation workflows and evaluate financial forecasts.
- Startup Founders: Understand the valuation methods applied to major public firms like Toyota Tsusho.
- Consultants: Produce detailed valuation reports for your clients’ needs.
- Students and Educators: Utilize real market data to learn and teach valuation strategies.
Overview of Template Components
- Preloaded 8015T Data: Historical and projected financial metrics, encompassing revenue, EBIT, and capital expenditures.
- DCF and WACC Models: High-quality spreadsheets designed for calculating intrinsic value and Weighted Average Cost of Capital.
- Editable Inputs: Cells highlighted in yellow for modifying revenue growth, tax rates, and discount rates.
- Financial Statements: Detailed annual and quarterly financial reports for thorough analysis.
- Key Ratios: Metrics for profitability, leverage, and efficiency to assess performance.
- Dashboard and Charts: Visual representations of valuation results and underlying assumptions.
Disclaimer
All information, articles, and product details provided on this website are for general informational and educational purposes only. We do not claim any ownership over, nor do we intend to infringe upon, any trademarks, copyrights, logos, brand names, or other intellectual property mentioned or depicted on this site. Such intellectual property remains the property of its respective owners, and any references here are made solely for identification or informational purposes, without implying any affiliation, endorsement, or partnership.
We make no representations or warranties, express or implied, regarding the accuracy, completeness, or suitability of any content or products presented. Nothing on this website should be construed as legal, tax, investment, financial, medical, or other professional advice. In addition, no part of this site—including articles or product references—constitutes a solicitation, recommendation, endorsement, advertisement, or offer to buy or sell any securities, franchises, or other financial instruments, particularly in jurisdictions where such activity would be unlawful.
All content is of a general nature and may not address the specific circumstances of any individual or entity. It is not a substitute for professional advice or services. Any actions you take based on the information provided here are strictly at your own risk. You accept full responsibility for any decisions or outcomes arising from your use of this website and agree to release us from any liability in connection with your use of, or reliance upon, the content or products found herein.