
|
AerCap Holdings N.V. (AER) DCF Valuation |
Entièrement Modifiable: Adapté À Vos Besoins Dans Excel Ou Sheets
Conception Professionnelle: Modèles Fiables Et Conformes Aux Normes Du Secteur
Pré-Construits Pour Une Utilisation Rapide Et Efficace
Compatible MAC/PC, entièrement débloqué
Aucune Expertise N'Est Requise; Facile À Suivre
AerCap Holdings N.V. (AER) Bundle
Optimize your time and improve precision with our (AER) DCF Calculator! Equipped with up-to-date AerCap data and customizable assumptions, this tool enables you to forecast, analyze, and evaluate AerCap Holdings N.V. like a seasoned investor.
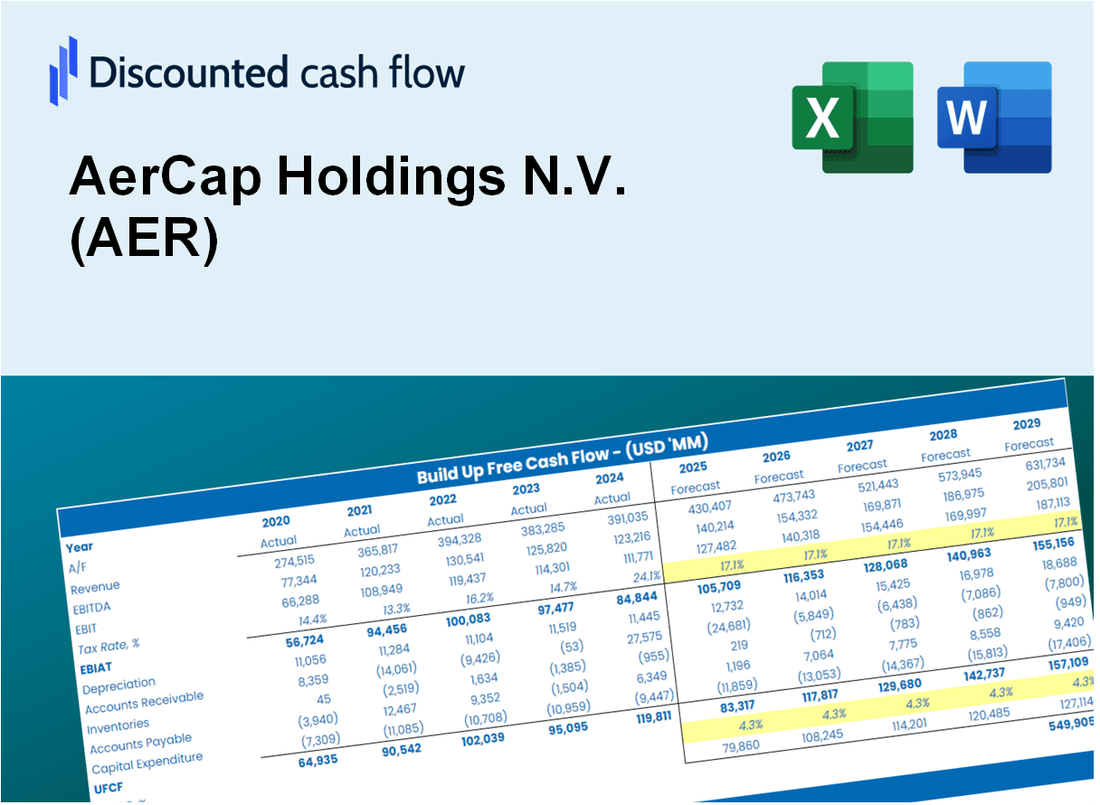
Discounted Cash Flow (DCF) - (USD MM)
| Year | AY1 2021 |
AY2 2022 |
AY3 2023 |
AY4 2024 |
AY5 2025 |
FY1 2026 |
FY2 2027 |
FY3 2028 |
FY4 2029 |
FY5 2030 |
|---|---|---|---|---|---|---|---|---|---|---|
| Revenue | 4,588.9 | 7,013.6 | 7,580.4 | 7,996.6 | 8,189.0 | 8,263.9 | 8,292.8 | 8,303.8 | 8,308.0 | 8,309.6 |
| Revenue Growth, % | 0 | 52.84 | 8.08 | 5.49 | 2.4 | 0.91568 | 0.34866 | 0.13276 | 0.05054931 | 0.01924738 |
| EBITDA | 3,952.0 | 5,790.4 | 3,913.1 | 4,149.2 | 8,721.1 | 6,151.5 | 6,172.9 | 6,181.1 | 6,184.3 | 6,185.4 |
| EBITDA, % | 86.12 | 82.56 | 51.62 | 51.89 | 106.5 | 74.44 | 74.44 | 74.44 | 74.44 | 74.44 |
| Depreciation | 1,737.9 | 2,389.8 | 33.8 | 31.8 | 2,647.2 | 1,737.4 | 1,743.4 | 1,745.7 | 1,746.6 | 1,746.9 |
| Depreciation, % | 37.87 | 34.07 | 0.44624 | 0.39789 | 32.33 | 21.02 | 21.02 | 21.02 | 21.02 | 21.02 |
| EBIT | 2,214.1 | 3,400.6 | 3,879.3 | 4,117.3 | 6,073.9 | 6,417.7 | 6,690.1 | 6,915.6 | 7,106.6 | 7,270.1 |
| EBIT, % | 48.25 | 48.49 | 51.17 | 51.49 | 74.17 | 77.66 | 80.67 | 83.28 | 85.54 | 87.49 |
| Total Cash | 1,728.8 | 1,597.1 | 1,627.2 | 1,209.2 | 1,479.7 | 1,902.4 | 1,909.0 | 1,911.6 | 1,912.5 | 1,912.9 |
| Total Cash, percent | .0 | .0 | .0 | .0 | .0 | .0 | .0 | .0 | .0 | .0 |
| Account Receivables | 4,093.7 | 3,502.7 | 3,832.2 | 3,449.6 | 1,856.0 | 4,223.0 | 4,237.7 | 4,243.4 | 4,245.5 | 4,246.3 |
| Account Receivables, % | 89.21 | 49.94 | 50.55 | 43.14 | 22.66 | 51.1 | 51.1 | 51.1 | 51.1 | 51.1 |
| Inventories | 48.6 | 55.9 | 85.7 | 90.9 | .0 | 68.1 | 68.4 | 68.5 | 68.5 | 68.5 |
| Inventories, % | 1.06 | 0.79657 | 1.13 | 1.14 | 0 | 0.82447 | 0.82447 | 0.82447 | 0.82447 | 0.82447 |
| Accounts Payable | 1,202.6 | 812.1 | 792.6 | 873.8 | 1,897.4 | 1,360.9 | 1,365.6 | 1,367.4 | 1,368.1 | 1,368.4 |
| Accounts Payable, % | 26.21 | 11.58 | 10.46 | 10.93 | 23.17 | 16.47 | 16.47 | 16.47 | 16.47 | 16.47 |
| Capital Expenditure | -1,789.8 | -3,871.6 | -6,232.4 | -6,616.4 | -6,074.3 | -5,509.3 | -5,528.5 | -5,535.9 | -5,538.7 | -5,539.8 |
| Capital Expenditure, % | -39 | -55.2 | -82.22 | -82.74 | -74.18 | -66.67 | -66.67 | -66.67 | -66.67 | -66.67 |
| Tax Rate, % | 12.9 | 12.9 | 12.9 | 12.9 | 12.9 | 12.9 | 12.9 | 12.9 | 12.9 | 12.9 |
| EBITAT | 1,890.2 | 2,789.0 | 3,537.7 | 3,567.1 | 5,290.7 | 5,549.0 | 5,784.6 | 5,979.5 | 6,144.7 | 6,286.1 |
| Depreciation | ||||||||||
| Changes in Account Receivables | ||||||||||
| Changes in Inventories | ||||||||||
| Changes in Accounts Payable | ||||||||||
| Capital Expenditure | ||||||||||
| UFCF | -1,101.4 | 1,500.5 | -3,039.7 | -2,558.9 | 4,571.7 | -1,194.7 | 1,989.2 | 2,185.5 | 2,351.1 | 2,492.7 |
| WACC, % | 5.48 | 5.39 | 5.65 | 5.52 | 5.53 | 5.52 | 5.52 | 5.52 | 5.52 | 5.52 |
| PV UFCF | ||||||||||
| SUM PV UFCF | 6,317.4 | |||||||||
| Long Term Growth Rate, % | 2.00 | |||||||||
| Free cash flow (T + 1) | 2,543 | |||||||||
| Terminal Value | 72,330 | |||||||||
| Present Terminal Value | 55,302 | |||||||||
| Enterprise Value | 61,620 | |||||||||
| Net Debt | 42,086 | |||||||||
| Equity Value | 19,534 | |||||||||
| Diluted Shares Outstanding, MM | 176 | |||||||||
| Equity Value Per Share | 110.92 |
What You Will Get
- Real AER Financial Data: Pre-filled with AerCap Holdings' historical and projected data for precise analysis.
- Fully Editable Template: Modify key inputs like revenue growth, WACC, and EBITDA % with ease.
- Automatic Calculations: See AerCap's intrinsic value update instantly based on your changes.
- Professional Valuation Tool: Designed for investors, analysts, and consultants seeking accurate DCF results.
- User-Friendly Design: Simple structure and clear instructions for all experience levels.
Key Features
- Comprehensive Data: AerCap's historical financial reports and pre-filled projections.
- Customizable Parameters: Adjust WACC, tax rates, revenue growth, and EBITDA margins as needed.
- Real-Time Insights: Observe AerCap's intrinsic value recalculating instantly.
- Intuitive Visualizations: Dashboard graphs illustrate valuation outcomes and essential metrics.
- Designed for Precision: A reliable tool for analysts, investors, and finance professionals.
How It Works
- Step 1: Download the Excel file.
- Step 2: Review AerCap's pre-filled financial data and forecasts.
- Step 3: Modify key inputs such as fleet growth, cost of capital, and tax rates (highlighted cells).
- Step 4: Observe the DCF model update in real-time as you adjust your assumptions.
- Step 5: Evaluate the outputs and apply the results to your investment strategies.
Why Choose AerCap Holdings N.V. (AER)?
- Industry Leader: AerCap is a top player in the aircraft leasing sector, ensuring reliability.
- Global Reach: With a diverse portfolio, AerCap serves clients across the globe.
- Innovative Solutions: Advanced leasing options tailored to meet the needs of various airlines.
- Strong Financials: Robust financial performance provides confidence in investment stability.
- Expert Team: A dedicated team of professionals committed to delivering exceptional service.
Who Should Use AerCap Holdings N.V. (AER)?
- Investors: Gain insights into the aircraft leasing market with a reliable investment analysis tool.
- Financial Analysts: Streamline your evaluations with a comprehensive financial model tailored for AerCap (AER).
- Consultants: Effortlessly modify the framework for client engagements or strategic reports.
- Aviation Enthusiasts: Enhance your knowledge of the industry dynamics and valuation methodologies through practical examples.
- Educators and Students: Utilize it as an effective resource for learning about finance and aviation economics.
What the Template Contains
- Pre-Filled DCF Model: AerCap Holdings N.V.'s (AER) financial data preloaded for immediate use.
- WACC Calculator: Detailed calculations for Weighted Average Cost of Capital.
- Financial Ratios: Evaluate AerCap's (AER) profitability, leverage, and efficiency.
- Editable Inputs: Change assumptions such as growth, margins, and CAPEX to fit your scenarios.
- Financial Statements: Annual and quarterly reports to support detailed analysis.
- Interactive Dashboard: Easily visualize key valuation metrics and results.
Disclaimer
All information, articles, and product details provided on this website are for general informational and educational purposes only. We do not claim any ownership over, nor do we intend to infringe upon, any trademarks, copyrights, logos, brand names, or other intellectual property mentioned or depicted on this site. Such intellectual property remains the property of its respective owners, and any references here are made solely for identification or informational purposes, without implying any affiliation, endorsement, or partnership.
We make no representations or warranties, express or implied, regarding the accuracy, completeness, or suitability of any content or products presented. Nothing on this website should be construed as legal, tax, investment, financial, medical, or other professional advice. In addition, no part of this site—including articles or product references—constitutes a solicitation, recommendation, endorsement, advertisement, or offer to buy or sell any securities, franchises, or other financial instruments, particularly in jurisdictions where such activity would be unlawful.
All content is of a general nature and may not address the specific circumstances of any individual or entity. It is not a substitute for professional advice or services. Any actions you take based on the information provided here are strictly at your own risk. You accept full responsibility for any decisions or outcomes arising from your use of this website and agree to release us from any liability in connection with your use of, or reliance upon, the content or products found herein.