
|
Alstom SA (ALO.PA) Évaluation DCF |
Entièrement Modifiable: Adapté À Vos Besoins Dans Excel Ou Sheets
Conception Professionnelle: Modèles Fiables Et Conformes Aux Normes Du Secteur
Pré-Construits Pour Une Utilisation Rapide Et Efficace
Compatible MAC/PC, entièrement débloqué
Aucune Expertise N'Est Requise; Facile À Suivre
Alstom SA (ALO.PA) Bundle
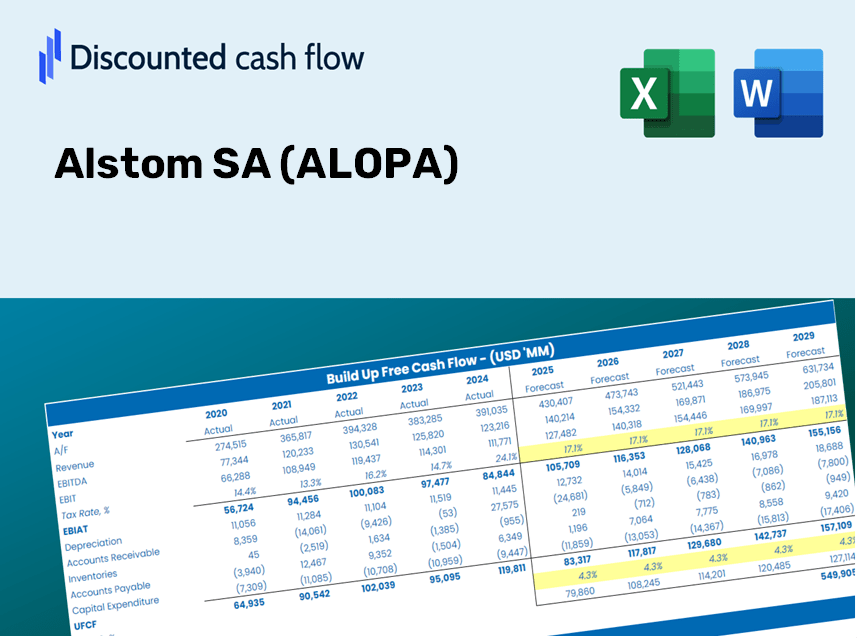
Évaluez les perspectives financières d'Alstom SA comme un expert! Cette calculatrice (Alopa) DCF vous offre des finances pré-remplies et une pleine flexibilité pour modifier la croissance des revenus, le WACC, les marges et d'autres hypothèses essentielles pour s'aligner sur vos prévisions.
Discounted Cash Flow (DCF) - (USD MM)
| Year | AY1 2021 |
AY2 2022 |
AY3 2023 |
AY4 2024 |
AY5 2025 |
FY1 2026 |
FY2 2027 |
FY3 2028 |
FY4 2029 |
FY5 2030 |
|---|---|---|---|---|---|---|---|---|---|---|
| Revenue | 8,785.0 | 15,471.0 | 16,507.0 | 17,619.0 | 18,489.0 | 22,856.0 | 28,254.5 | 34,928.0 | 43,177.8 | 53,376.2 |
| Revenue Growth, % | 0 | 76.11 | 6.7 | 6.74 | 4.94 | 23.62 | 23.62 | 23.62 | 23.62 | 23.62 |
| EBITDA | 655.0 | 732.0 | 766.0 | 762.0 | 1,258.0 | 1,278.0 | 1,579.8 | 1,952.9 | 2,414.2 | 2,984.4 |
| EBITDA, % | 7.46 | 4.73 | 4.64 | 4.32 | 6.8 | 5.59 | 5.59 | 5.59 | 5.59 | 5.59 |
| Depreciation | 391.0 | 876.0 | 886.0 | 836.0 | 874.0 | 1,140.6 | 1,410.0 | 1,743.1 | 2,154.8 | 2,663.7 |
| Depreciation, % | 4.45 | 5.66 | 5.37 | 4.74 | 4.73 | 4.99 | 4.99 | 4.99 | 4.99 | 4.99 |
| EBIT | 264.0 | -144.0 | -120.0 | -74.0 | 384.0 | 137.3 | 169.8 | 209.9 | 259.4 | 320.7 |
| EBIT, % | 3.01 | -0.93077 | -0.72696 | -0.42 | 2.08 | 0.60086 | 0.60086 | 0.60086 | 0.60086 | 0.60086 |
| Total Cash | 1,250.0 | 810.0 | 826.0 | 976.0 | 2,274.0 | 1,933.9 | 2,390.7 | 2,955.4 | 3,653.4 | 4,516.4 |
| Total Cash, percent | .0 | .0 | .0 | .0 | .0 | .0 | .0 | .0 | .0 | .0 |
| Account Receivables | 4,988.0 | 6,565.0 | 7,179.0 | 7,918.0 | 9,269.0 | 10,869.2 | 13,436.5 | 16,610.1 | 20,533.3 | 25,383.2 |
| Account Receivables, % | 56.78 | 42.43 | 43.49 | 44.94 | 50.13 | 47.56 | 47.56 | 47.56 | 47.56 | 47.56 |
| Inventories | 2,962.0 | 3,274.0 | 3,729.0 | 3,818.0 | 4,151.0 | 5,558.1 | 6,870.9 | 8,493.8 | 10,500.0 | 12,980.0 |
| Inventories, % | 33.72 | 21.16 | 22.59 | 21.67 | 22.45 | 24.32 | 24.32 | 24.32 | 24.32 | 24.32 |
| Accounts Payable | 3,615.0 | 3,647.0 | 3,640.0 | 1,533.0 | 3,974.0 | 5,346.9 | 6,609.8 | 8,171.0 | 10,100.9 | 12,486.7 |
| Accounts Payable, % | 41.15 | 23.57 | 22.05 | 8.7 | 21.49 | 23.39 | 23.39 | 23.39 | 23.39 | 23.39 |
| Capital Expenditure | -265.0 | -428.0 | -431.0 | -485.0 | -482.0 | -628.7 | -777.2 | -960.8 | -1,187.7 | -1,468.2 |
| Capital Expenditure, % | -3.02 | -2.77 | -2.61 | -2.75 | -2.61 | -2.75 | -2.75 | -2.75 | -2.75 | -2.75 |
| Tax Rate, % | 40.16 | 40.16 | 40.16 | 40.16 | 40.16 | 40.16 | 40.16 | 40.16 | 40.16 | 40.16 |
| EBITAT | 207.0 | -157.1 | -219.4 | -90.0 | 229.8 | 120.4 | 148.8 | 184.0 | 227.4 | 281.1 |
| Depreciation | ||||||||||
| Changes in Account Receivables | ||||||||||
| Changes in Inventories | ||||||||||
| Changes in Accounts Payable | ||||||||||
| Capital Expenditure | ||||||||||
| UFCF | -4,002.0 | -1,566.1 | -840.4 | -2,674.0 | 1,378.8 | -1,002.2 | -1,835.5 | -2,269.1 | -2,805.0 | -3,467.5 |
| WACC, % | 7.62 | 7.82 | 7.82 | 7.82 | 7.44 | 7.7 | 7.7 | 7.7 | 7.7 | 7.7 |
| PV UFCF | ||||||||||
| SUM PV UFCF | -8,805.7 | |||||||||
| Long Term Growth Rate, % | 3.50 | |||||||||
| Free cash flow (T + 1) | -3,589 | |||||||||
| Terminal Value | -85,350 | |||||||||
| Present Terminal Value | -58,888 | |||||||||
| Enterprise Value | -67,694 | |||||||||
| Net Debt | 1,248 | |||||||||
| Equity Value | -68,942 | |||||||||
| Diluted Shares Outstanding, MM | 439 | |||||||||
| Equity Value Per Share | -157.17 |
What You Will Receive
- Flexible Forecast Inputs: Effortlessly adjust key assumptions (growth %, margins, WACC) to simulate various scenarios.
- Comprehensive Data: Alstom SA’s financial information pre-loaded to enhance your analysis.
- Instant DCF Calculations: The template automatically computes Net Present Value (NPV) and intrinsic value for you.
- Tailored and Professional: A refined Excel model designed to meet your valuation requirements.
- Designed for Analysts and Investors: Perfect for evaluating projections, confirming strategies, and optimizing your time.
Key Features of Alstom SA (ALOPA)
- Authentic Financial Data: Gain access to precise historical records and future forecasts.
- Adjustable Forecast Parameters: Modify the highlighted fields for metrics like WACC, growth rates, and profit margins.
- Real-Time Calculations: Automatic updates for DCF, Net Present Value (NPV), and cash flow analyses.
- Informative Dashboard: User-friendly charts and summaries to help you interpret valuation results easily.
- Designed for All Skill Levels: A straightforward, intuitive layout suitable for investors, CFOs, and consultants alike.
How It Functions
- 1. Access the Template: Download and open the Excel file containing Alstom SA’s (ALOPA) preloaded data.
- 2. Modify Assumptions: Adjust crucial inputs such as growth rates, WACC, and capital expenditures.
- 3. View Results Instantly: The DCF model automatically calculates the intrinsic value and NPV.
- 4. Explore Scenarios: Evaluate various forecasts to examine different valuation results.
- 5. Use with Assurance: Present insightful professional valuations to inform your decisions.
Why Opt for This Calculator?
- Designed for Experts: A sophisticated tool utilized by financial analysts, CFOs, and industry consultants.
- Verified Data: Alstom SA’s (ALOPA) historical and forecasted financial information is pre-installed for precise analysis.
- Scenario Analysis: Effortlessly test various forecasts and assumptions.
- Clear Results: Instantly calculates intrinsic value, NPV, and essential financial metrics.
- User-Friendly: Comprehensive step-by-step guidance ensures a smooth experience.
Who Should Use This Product?
- Professional Investors: Develop comprehensive and accurate valuation models for assessing portfolios related to Alstom SA (ALOPA).
- Corporate Finance Teams: Evaluate various valuation scenarios to inform strategic decisions within the company.
- Consultants and Advisors: Deliver precise valuation insights for clients interested in Alstom SA (ALOPA) stock.
- Students and Educators: Utilize real-world data to enhance learning and practice in financial modeling.
- Tech Enthusiasts: Gain insights into how companies like Alstom SA (ALOPA) are valued within the industry.
Components of the Template
- Pre-Filled Data: Contains Alstom SA’s historical financial performance and projections.
- Discounted Cash Flow Model: An editable DCF valuation model with automatic calculations included.
- Weighted Average Cost of Capital (WACC): A specific sheet for determining WACC using customized inputs.
- Key Financial Ratios: Evaluate Alstom SA's profitability, efficiency, and financial leverage.
- Customizable Inputs: Easily modify revenue growth, profit margins, and tax rates.
- User-Friendly Dashboard: Visualizations and tables summarizing essential valuation findings.
Disclaimer
All information, articles, and product details provided on this website are for general informational and educational purposes only. We do not claim any ownership over, nor do we intend to infringe upon, any trademarks, copyrights, logos, brand names, or other intellectual property mentioned or depicted on this site. Such intellectual property remains the property of its respective owners, and any references here are made solely for identification or informational purposes, without implying any affiliation, endorsement, or partnership.
We make no representations or warranties, express or implied, regarding the accuracy, completeness, or suitability of any content or products presented. Nothing on this website should be construed as legal, tax, investment, financial, medical, or other professional advice. In addition, no part of this site—including articles or product references—constitutes a solicitation, recommendation, endorsement, advertisement, or offer to buy or sell any securities, franchises, or other financial instruments, particularly in jurisdictions where such activity would be unlawful.
All content is of a general nature and may not address the specific circumstances of any individual or entity. It is not a substitute for professional advice or services. Any actions you take based on the information provided here are strictly at your own risk. You accept full responsibility for any decisions or outcomes arising from your use of this website and agree to release us from any liability in connection with your use of, or reliance upon, the content or products found herein.